Summary: The Rounding Top Chart Pattern is a bearish reversal pattern that forms a smooth “∩” shape, signaling that a rising market is slowly losing strength. This pattern shows that sellers are taking control, and prices may start to fall. Traders use it to spot sell opportunities after a long uptrend.
In this blog post, we’ll learn about the rounding top chart pattern, how to identify it, trading strategies, examples, and essential tips to consider while trading with it. So, let’s discuss…
What is the Rounding Top Chart Pattern?

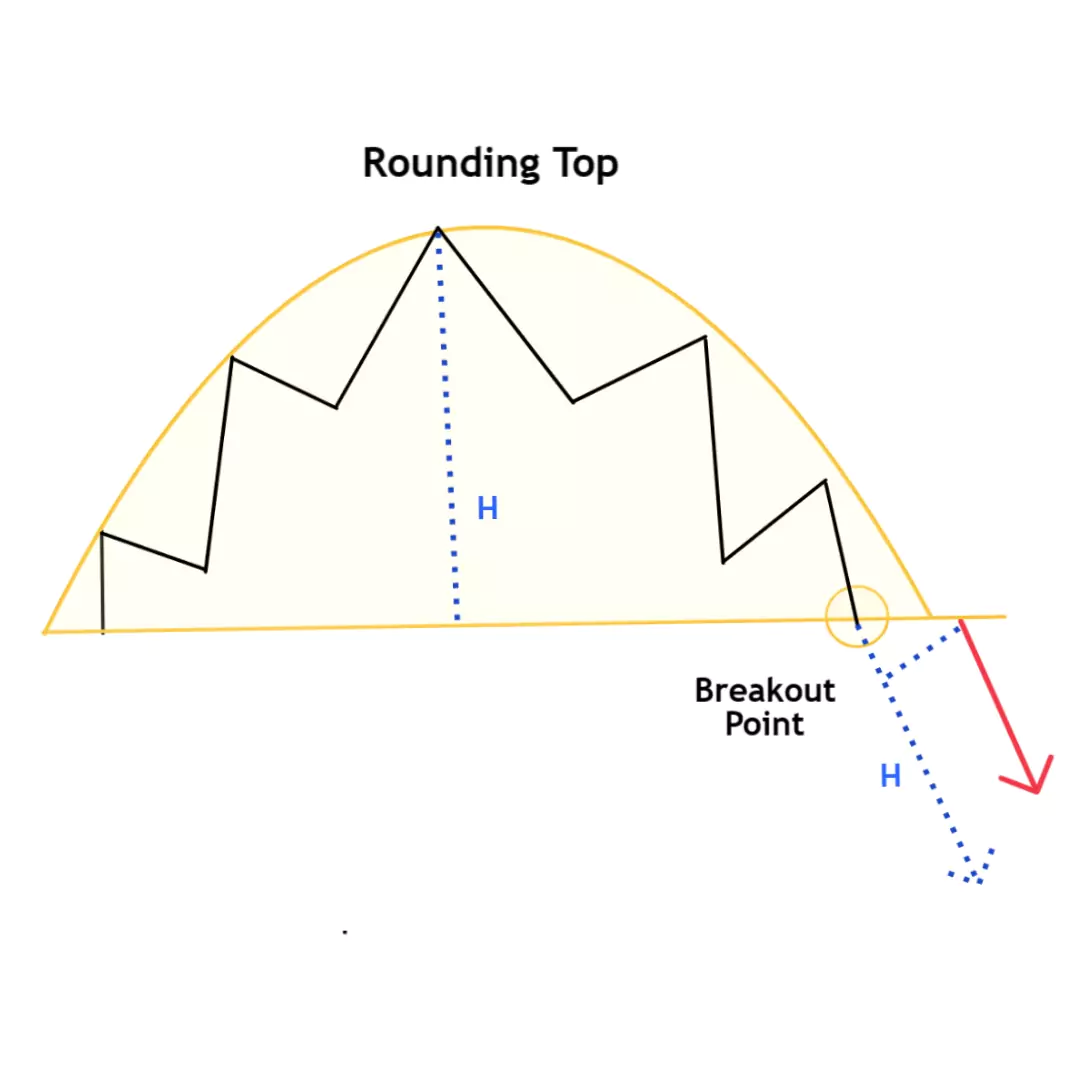
The Rounding Top Pattern, also known as the Saucer Top, looks like an “∩” shape and signals a slow and steady reversal of an upward trend. Unlike sharp peaks, this pattern forms over a longer period, showing a gradual shift in market sentiment. It usually appears on daily or weekly charts and is confirmed by a breakdown below the support level.
How to Identify the Rounding Top Chart Pattern
It’s straightforward. Just look “∩” shape and follow these steps:
- Shape: Smooth and rounded “∩” shape.
- Trend: Appears after a sustained uptrend.
- Price Action: Price increases during the rise, then moves sideways at the top (forming the curve), and slowly starts to fall, signaling a possible trend reversal.
- Support Level: The low point before the uptrend.
- Breakout: A candle close below the support confirms the pattern.
Formation of a Rounding Top Pattern
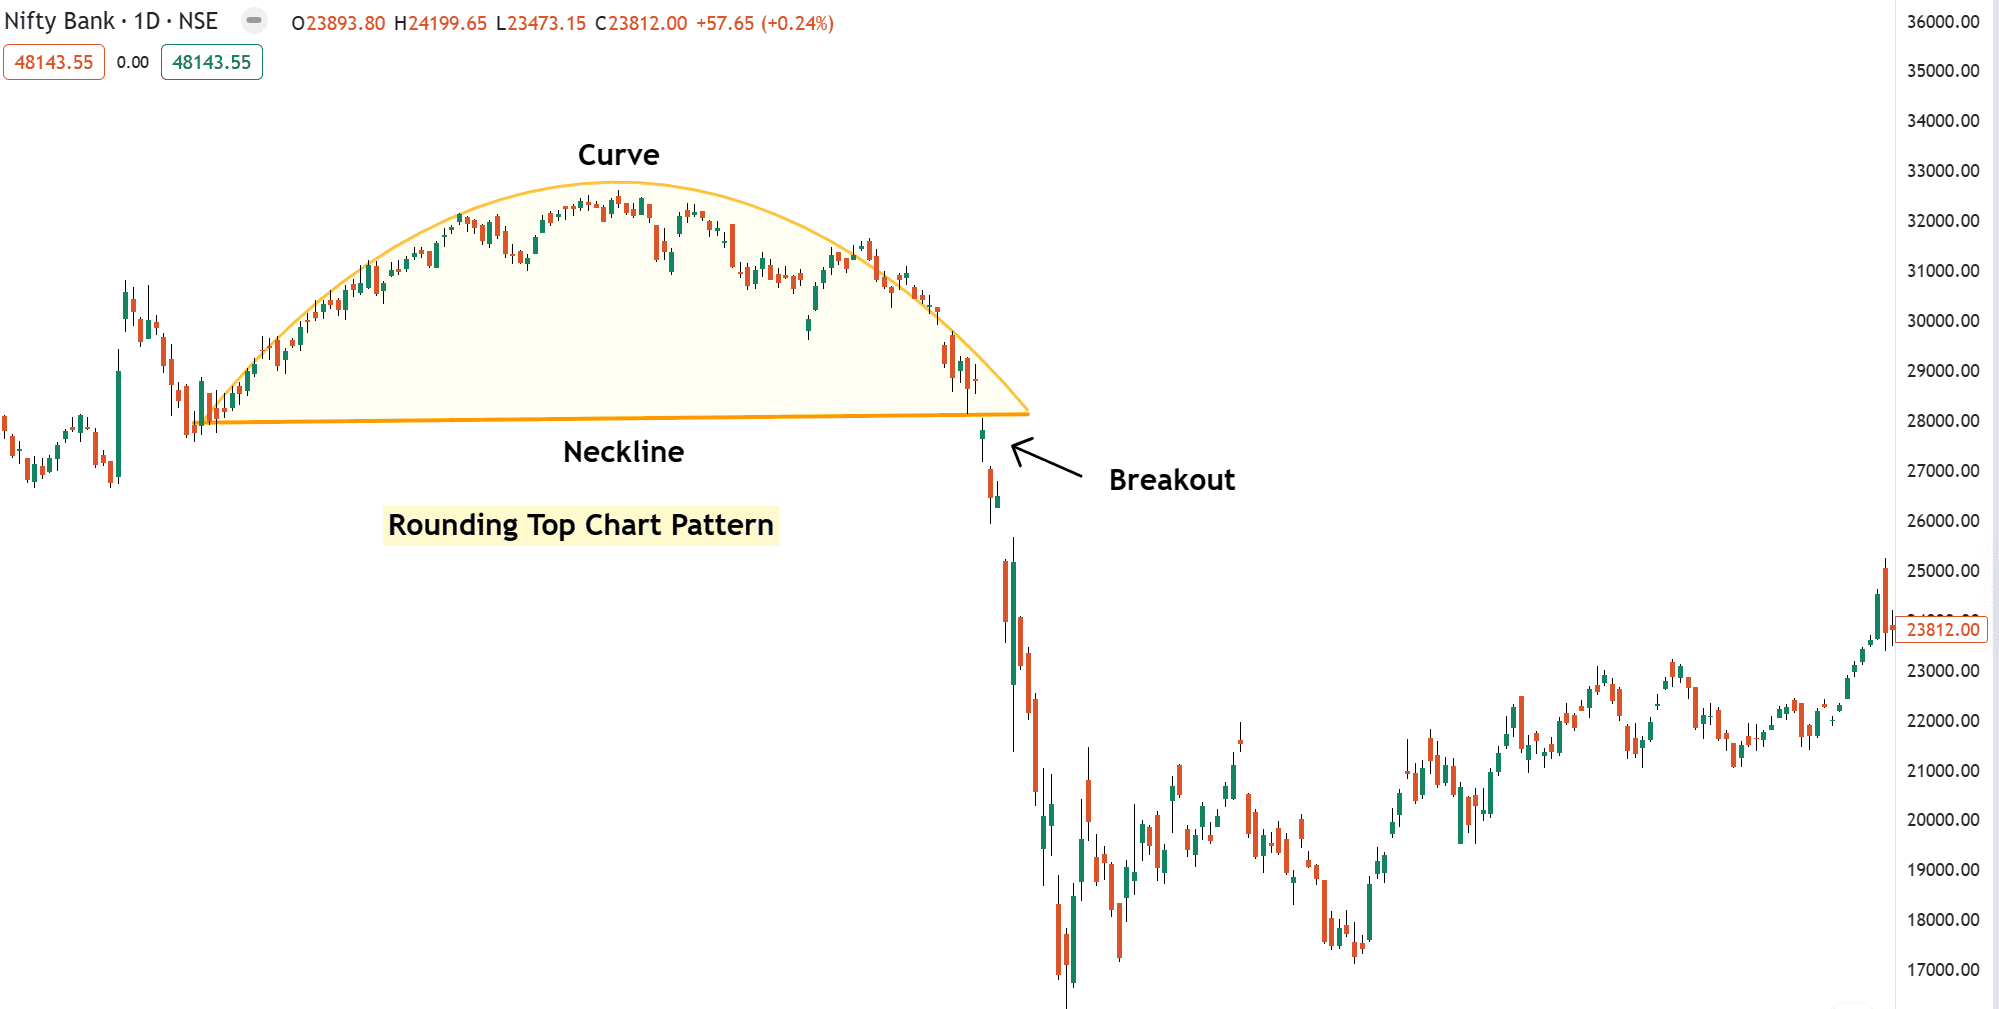
Example 1: Nifty Bank Rounding Top Formation Analysis

Uptrend Phase
First, the market starts with rising prices, showing a strong bullish trend.
Top Phase (Sideways)
The price slows down and moves sideways for a while. This shows that buying is weakening and sellers are starting to step in.
Downtrend Phase
The price gradually starts falling, forming the right side of the “∩” shape.
Support
This is the previous low before the uptrend started.
Once the price breaks and closes below the support line, the pattern is confirmed.
How to Trade the Rounding Top Pattern
Once you’ve spotted this, there are certain rules to prepare for the perfect trading entry!
Entery
When the price confidently breaks and closes below the support, it is a sign that the pattern is about to reveal its full potential.
Traders enter a short position when the price breaks below the support level. This breakout offers a good opportunity to ride the wave of success!
Note: If you miss the breakout, don’t “chase” the markets or wait for a proper pullback.
Stop Loss
The stop-loss should be placed above the midpoint or the top of the pattern.
Note: If the price moves in your direction, trail your stop loss using this technical indicator (eg, 20 Moving Average) to protect your gains.
Exit
Measure the height of the pattern and add this distance to the breakout point likely 1:1 to determine the profit target.
Pros & Cons of Rounding Top Pattern
Pros
- Strong bearish reversal signal
- Works well on longer timeframes.
Cons
- Time-consuming & requires patience
- Risk of false breakouts
Common Mistakes to Avoid
The duration of the pattern plays a key role, the longer it takes to form, the stronger and more significant to find the reversal signal. Shorter patterns are weaker and more likely to get false breakouts.
- Wrong timeframe: Best results are seen on higher timeframes like daily or weekly charts
- Entering before breakout: Always wait for a confirmed breakout above resistance.
Here’s what I’m curious about…..
Have you traded the rounding bottom or top patterns before? What is your favorite chart pattern aside from this?
Let me know in the comments below and share your thoughts!…..

