Summary: The Pole and Flag Chart Pattern is a bullish continuation pattern that signals a brief pause before the price resumes its trend. It consists of a strong price move (the pole) followed by a short consolidation (the flag). Once the price breaks out of the flag, it continues in the bullish direction. This pattern gives a clear entry, stop-loss, and target levels with strong risk-reward potential.
In this blog post, we’ll learn about the pole and flag chart pattern, how to identify it, trading strategies, examples, and important tips to consider while trading with it. So, let’s discuss…
What is the Pole and Flag Chart Pattern?

The Pole and Flag Chart Pattern is a popular bullish continuation pattern used in technical analysis to identify an uptrend.
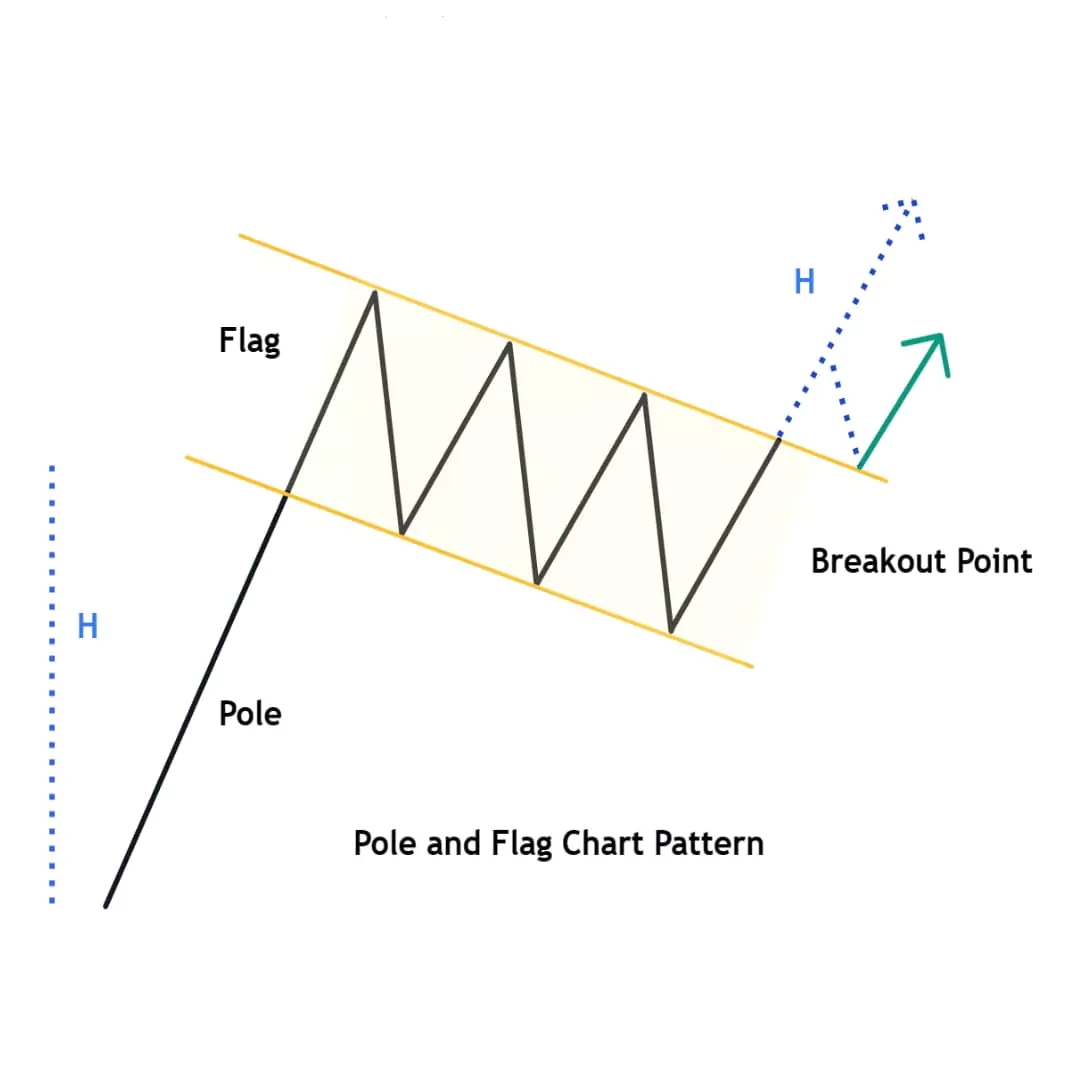
The pattern looks like a strong price move followed by a short pause, just like a flag on a pole. First, the price rises or falls that is the pole. Then it takes a pause and moves sideways or slightly against the trend that’s the flag. After this short rest, the trend usually continues in the same direction.
It’s a popular and simple pattern that helps traders spot good entry points during trend continuation.
How to Identify Pole and Flag Chart Pattern
It’s simple! Just looks like a flag waving on a pole. Follow these steps:
- Pole – A sharp upward move, showing a strong bullish trend.
- Flag – Sideways in consolidation area. It should be smaller than the pole
- The pattern is confirmed when the price breaks out from the flag area, which is known as consolidation.
Formation of Pole and Flag Pattern
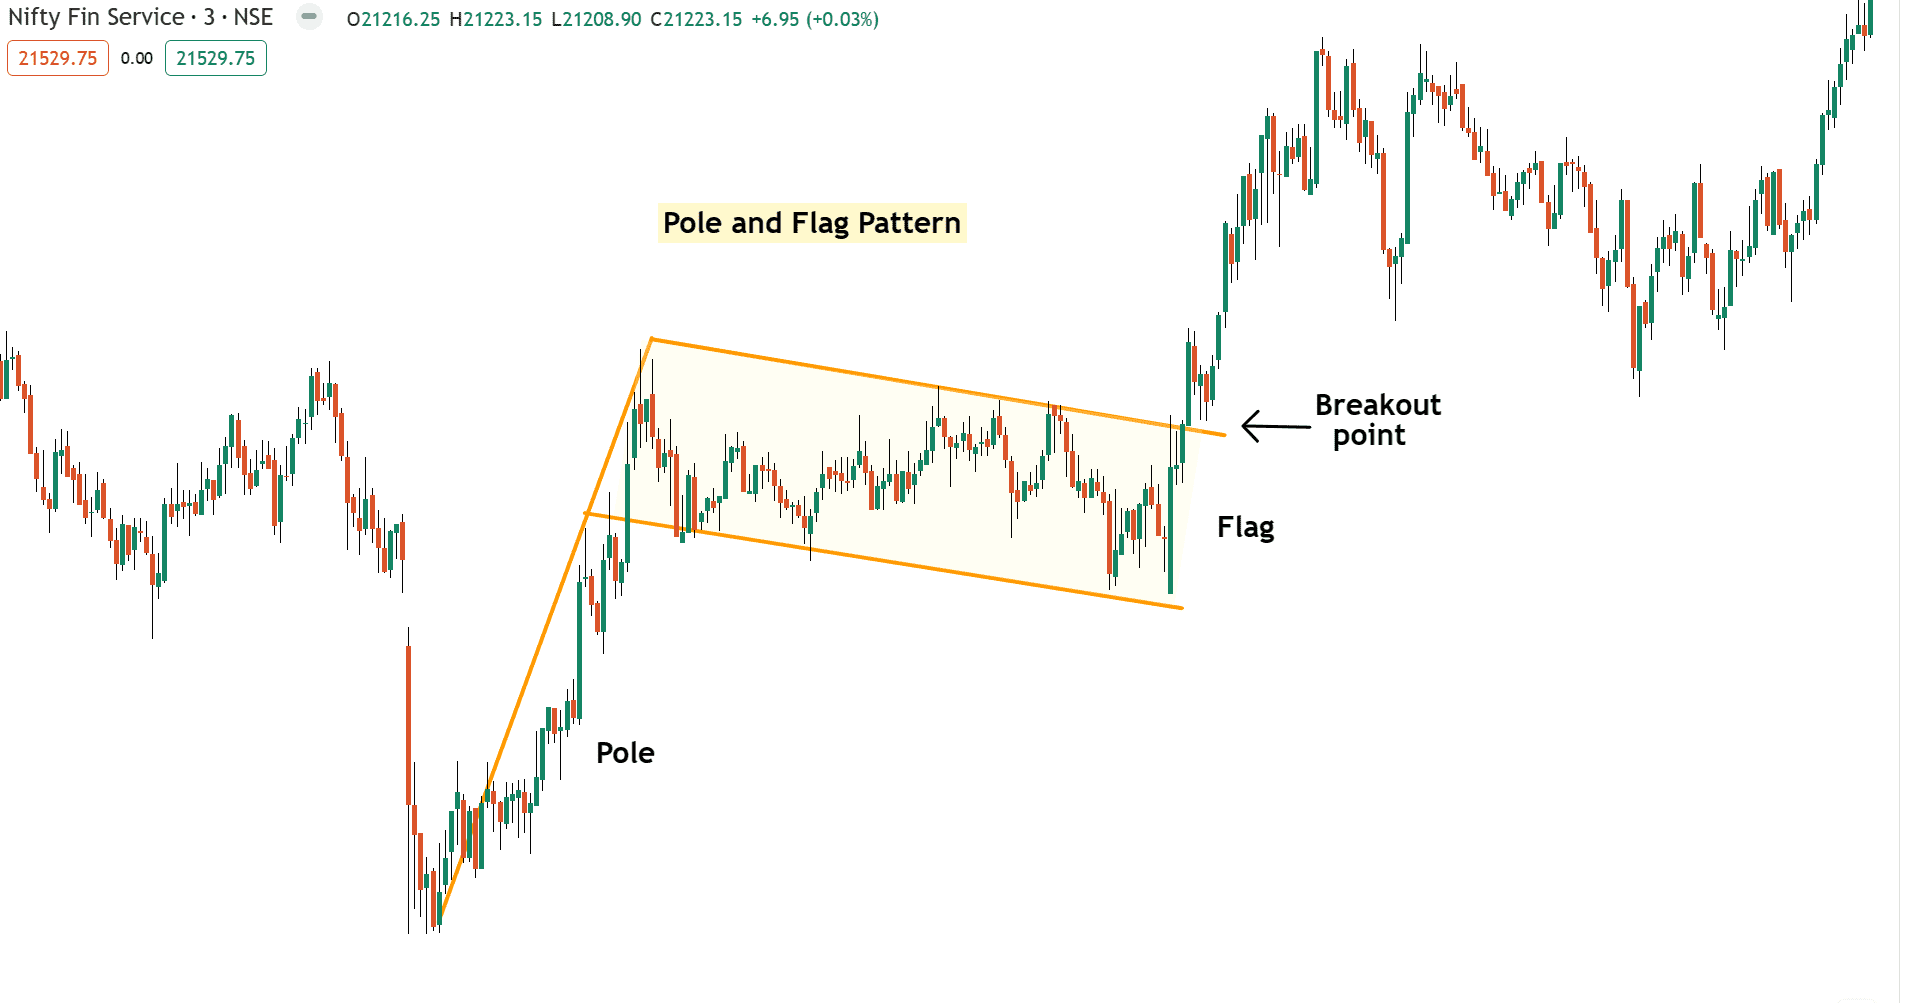
Example 1: Nifty Fin Service Pole & Flag Formation Analysis

Pole Formation
The pole is created when the price moves sharply upward in a short period of time represents a strong bullish momentum.
This usually happens after a major news event or breakout from another chart pattern showing strong buying interest.
Flag Formation
After sudden rise, the price takes a short pause and moves sideways in slightly downward direction like a falling channel.
This creates the flag shape like a small rectangle downward channel.
Breakout
When the pause is over and price breaks above the upper trendline of the flag so we see a sharp and quick bullish breakout confirming the continuation of the trend.
How to Trade Pole and Flag Pattern
There are some rules when trading with bullish pole and flag patterns..
Once you’ve spotted thispole and flag masterpiece, now prepare for the perfect trading entry!
Entery Point
Enter the trade when price breaks above the upper trendline of the flag and wait for a candle close above the flag for confirmation.
Stop Loss
Place the stop loss below the bottom of the flag to manage risk.
If the price moves in your direction, trail your stop loss using this technical indicator (eg, 20 Moving Average) to protect your gains.
Profit Target
First measure the high of pole, then add that same distance above the point where the breakout happens. This gives you a rough idea of where the price might go next.
Pros & Cons of Pole & Flag Pattern
Pros
- High probability setups in trending with technical patterns.
- Easy to find pattern
- Provides well-defined entry, stop-loss, and target levels.
- Effective in various timeframes
Cons
- Requires high patience when market is in consolidation (Sideways)
Common Mistakes to Avoid
When trading with this pattern, avoid some common mistakes like trading inside the range and relying too much on textbook patterns.
- Don’t trade inside the flag. Wait for a clean breakout.
Most importantly, if the pattern looks confusing, it’s okay to skip the trade to protect your capital is more important.
Have you traded the Pole and Flag pattern before? What is your favorite chart pattern aside from the pole and flag?
Let me know in the comments below!…..

