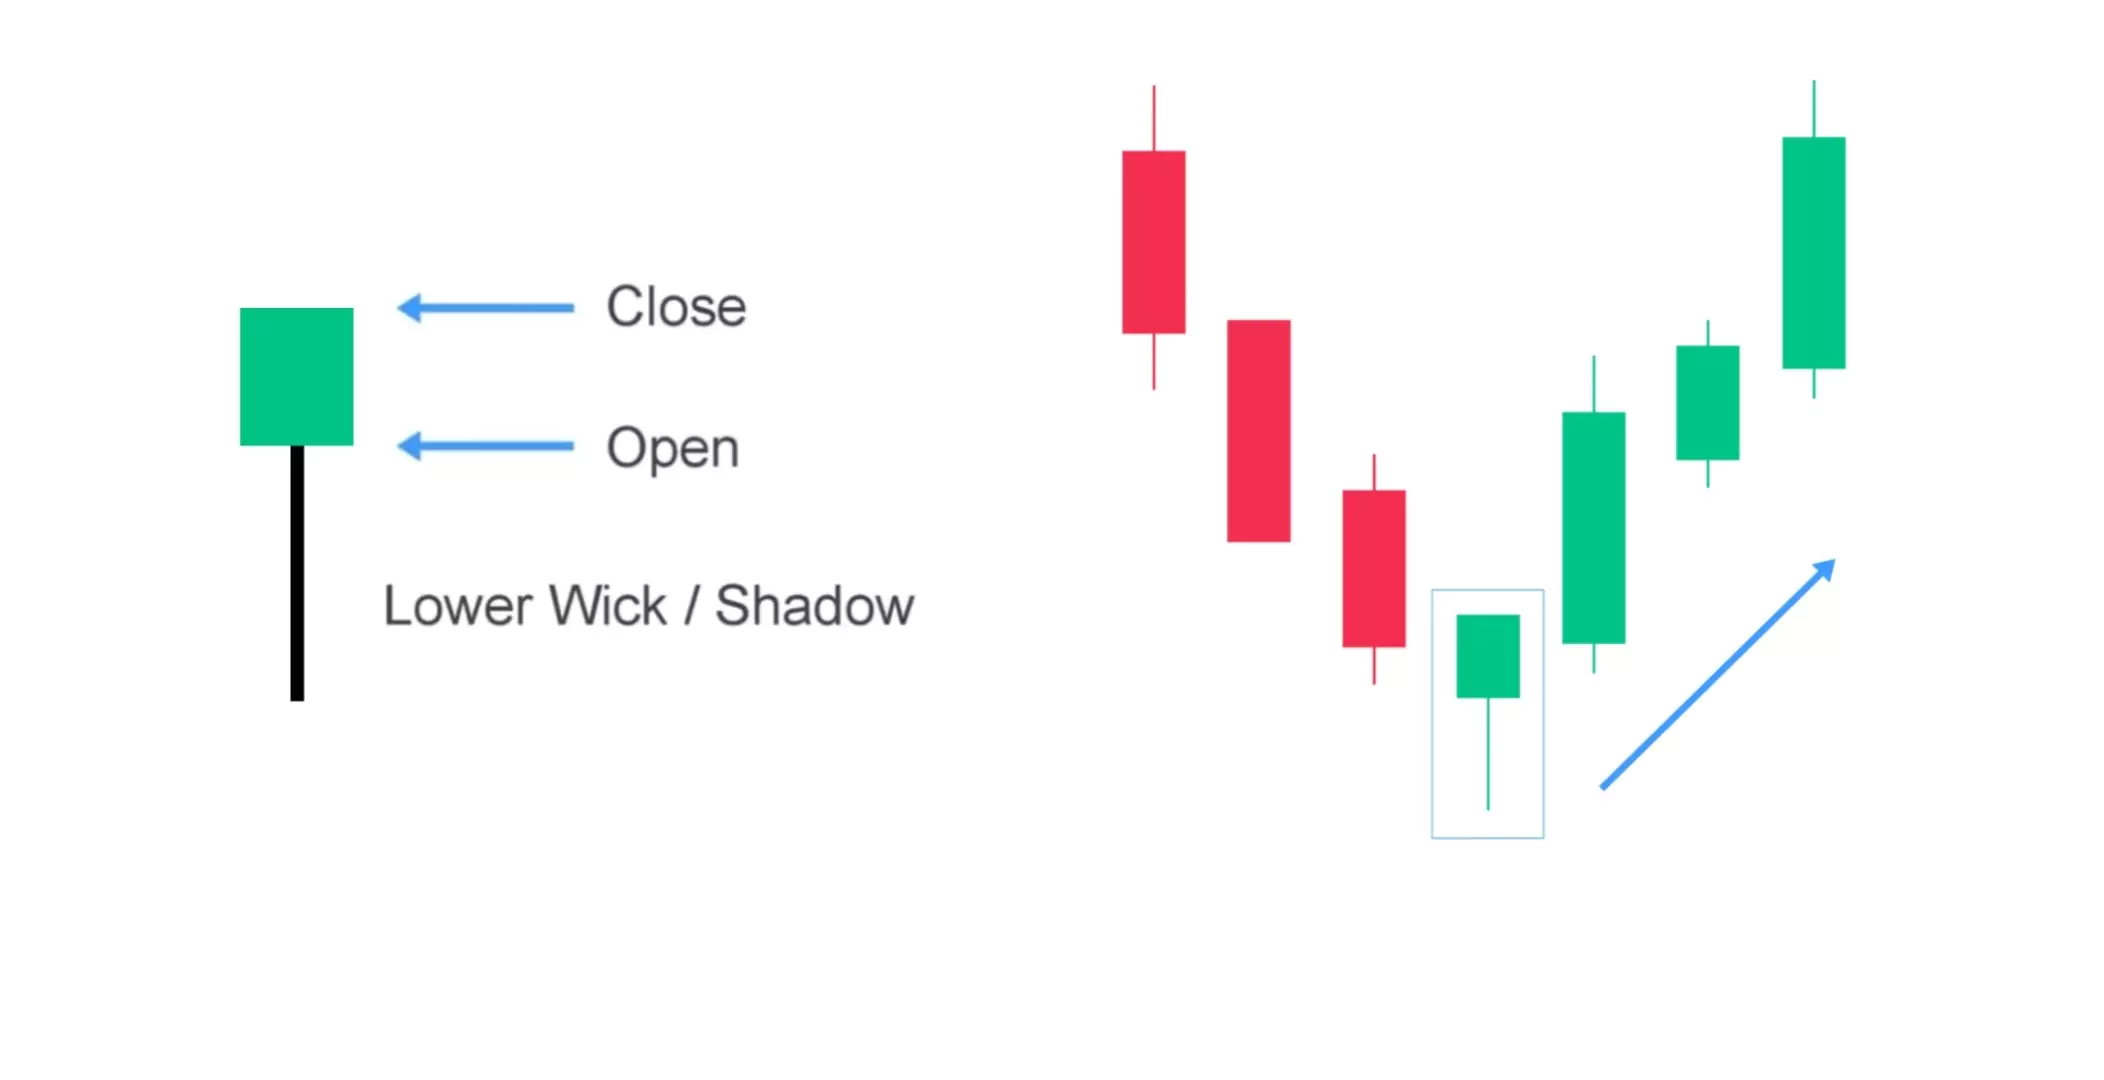
Summary: The Hammer Candlestick is a bullish reversal pattern that shows a possible trend reversal from down to up. It looks like a hammer with a small body at the top, and a long lower shadow tells us that buyers are getting stronger. Traders use it to find bullish reversals. Confirmation with the next candle and proper strategy helps increase accuracy and success.
Have you ever seen a candlestick on a chart with a small body and a long tail at the bottom? That might just be the hammer candlestick – one of the most powerful candlesticks of a bullish reversal in technical analysis.
In this blog post, we’ll learn about the Hammer Candlestick Pattern, how to identify it, trading strategies, examples, and important tips to consider while trading with it. So, let’s get started!
What is a Hammer Candlestick Pattern?

A Hammer Candlestick is a pattern used in technical analysis to find a bullish reversal, It signals that buyers are starting to gain strength and push prices higher.
It usually shows at the bottom of a downtrend, and helps traders to understand when the market changes direction
Key features of a hammer:
- It appears at the bottom of a downtrend.
- Has a small real body (green or red, but green is stronger)
- Has a long lower wick (at least twice the size of the body)
- Little or no upper wick
It looks like a hammer 🔨 — and that’s why it’s called a Hammer Candlestick!
Psychology Behind the Pattern
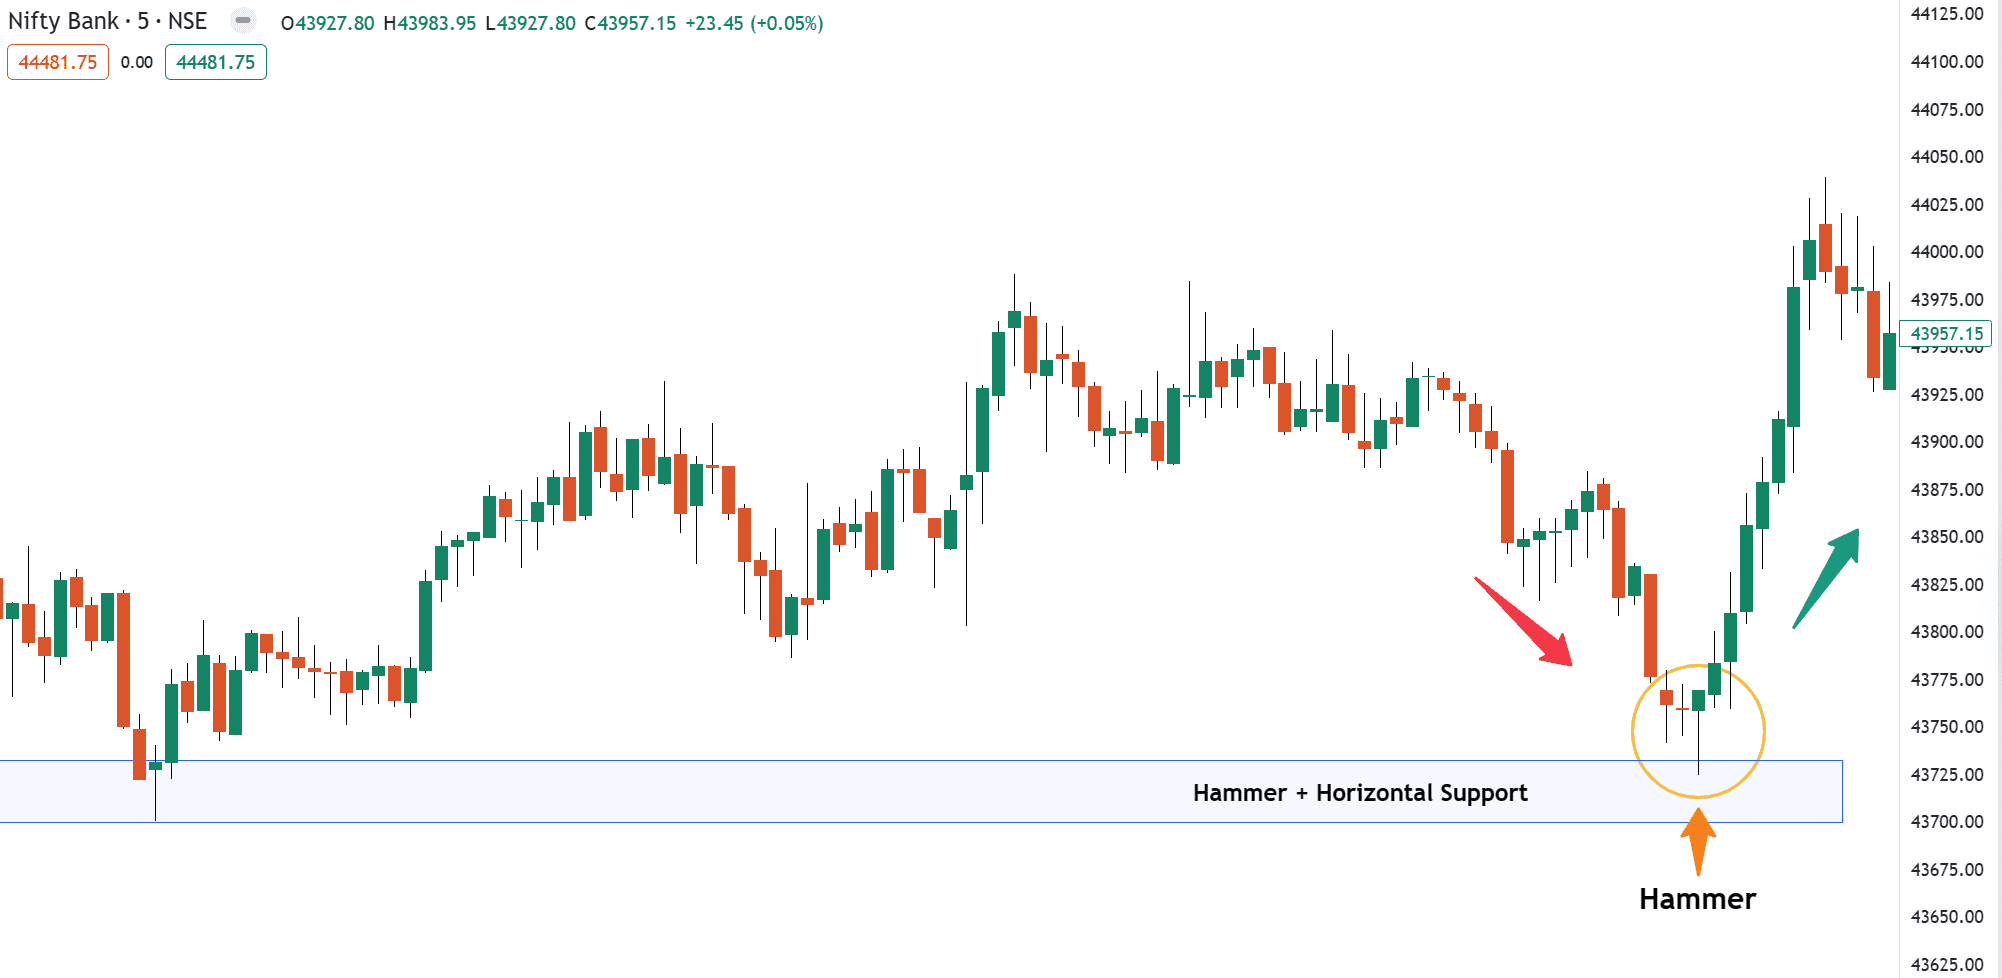
Example 1: Nifty Bank Hammer Candlestick Formation Analysis

Here, you can see the market is falling, and suddenly, in a single candle session, prices drop lower but then reverse and close above the open price. This means sellers tried to push prices down, but buyers stepped in with strength, and the market shifted the trend.
This shift tells traders that the downtrend might be losing strength and a bullish reversal could follow.
What does a hammer mean?
- When the candle formed, the sellers took control and pushed the price lower
- Under the selling pressure, suddenly huge buying pressure stepped in and pushed the price higher
- The buying pressure is so strong that it closed above the opening price of the candle.
In short, a hammer is a bullish candlestick reversal pattern that shows rejection of lower prices.
Now, this is the most important tip.
Just because you see a bullish Hammer candlestick doesn’t mean you go long immediately, because the context of the market is more important than the Hammer. The Hammer candle doesn’t tell you the direction of the overall trend.
You should know the basic concept of price action, As you can see in the above example that when this candle was formed then the price is at support level so with the help of this candle we used to find the bullish trend, but if it happens randomly at different places then it also leads to chasing loss.
So you can increase the accuracy of candlesticks with the help of price action.
How to Identify a Hammer Candlestick Pattern
To confidently find a hammer, follow these simple steps:
| Criteria | Important Points |
| Trend Direction | Appear after a downtrend (near support level) |
| Body | Small body near the top of the candle |
| Lower Shadow/Wick | Must be at least twice the length of the body |
| Upper Shadow | Very small or absent |
Look for confirmation on the next candle that breaks the high of the hammer.
How to Trade the Hammer Candlestick Pattern
Here’s a simple way to trade the hammer
First, find a clear downtrend and wait for a hammer candle to form at a support level. Now, wait for confirmation with the next bullish candle close above the high of the hammer.
Entry
Enter the trade when the next candle closes above the hammer’s high.
Stop Loss
Place the stop loss below the low of the hammer candle.
Target
Use recent resistance levels or a risk-reward ratio of 1:2 or 1:3 accordingly.
Note: Always wait for confirmation from the next candle before entering a trade.
Pros & Cons of Hammer Pattern
Pros
- Easy to identify (looks like a real hammer)
- Provides perfect entry and exit points
- Effective in various timeframes
Cons
- Needs confirmation
- False Signals
- Not effective in sideways markets.
Common Mistakes to Avoid
Avoid these mistakes to get more accuracy with the hammer candlestick pattern. Here are some comment mistakes:
Traders place trades without confirmation, Some traders also confuse the hammer with the hanging man, which looks similar but appears after an uptrend, ignoring the overall market structure & random trade in a sideways market.
Conclusion
So in this hammer trading strategy guide, you’ve learned:
- What is the Hammer Candlestick Pattern
- Psychology Behind the Pattern
- How to Identify a Hammer Candlestick Pattern Perfectly
- How to trade hammer like a PRO
- PRO & Cons with Common mistakes to avoid
Now I want to know…
How do you trade the hammer candlestick pattern?
Leave a comment below and share your thoughts with me.
If you found this post helpful, do share it with your fellow traders….
Happy Trading…..

