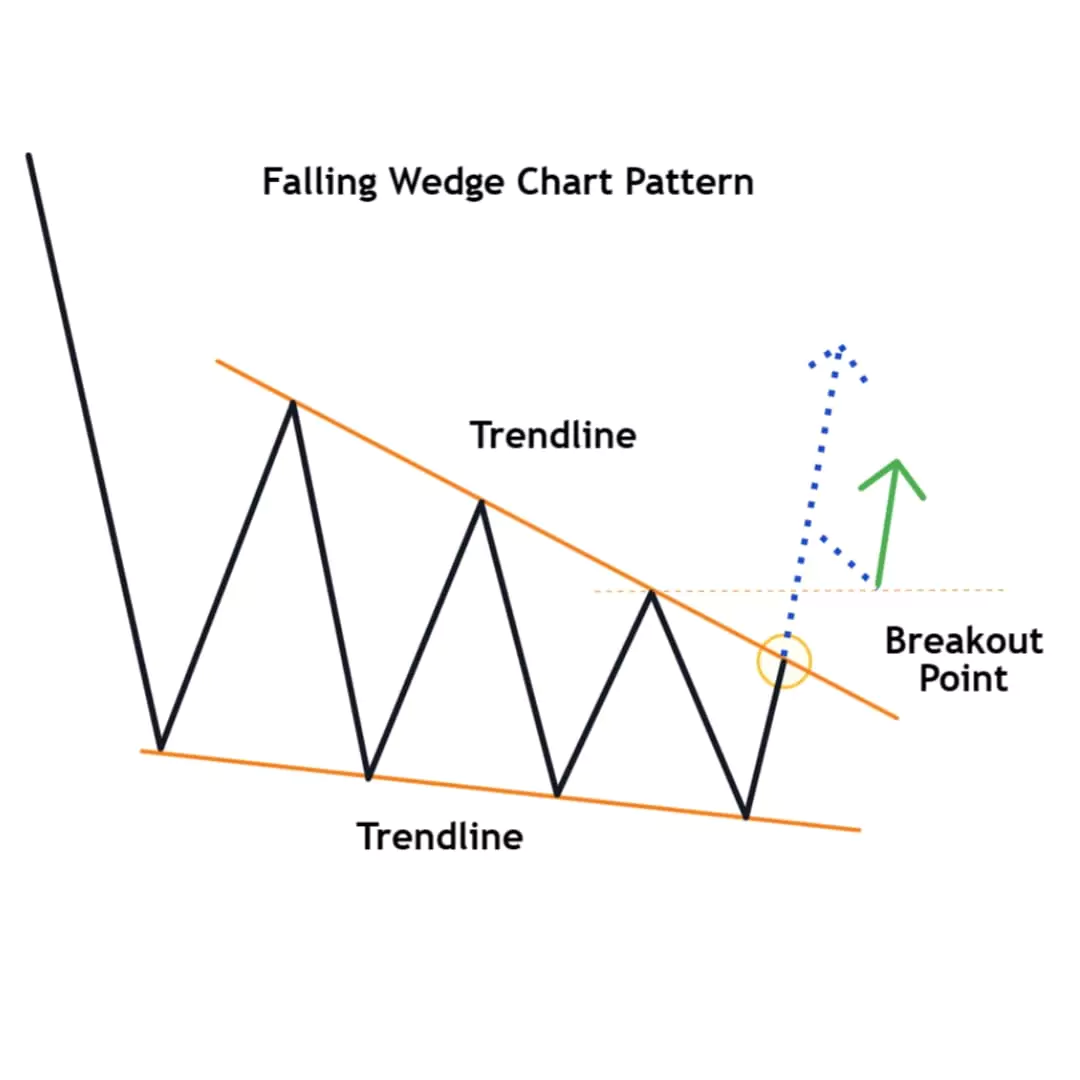
Summary: The Falling Wedge Chart Pattern is a bullish trend reversal pattern that appears after a downtrend. It’s formed by two lines that slope downwards, with the price making lower lows and lower highs, signaling a potential breakout to the upside. As the price moves inside the wedge, the downward movement slows down, suggesting a possible upward breakout when the pattern completes. Traders look for a breakout above the resistance line for confirmation of the reversal.
In this blog post, we’ll learn about the Falling Wedge Chart Pattern, how to identify it, trading strategies, examples, and essential tips to consider while trading with it. So, let’s discuss…
What is the Falling Wedge Chart Pattern?

The Falling Wedge Pattern is a trend reversal chart pattern that usually forms after a long period of falling prices. It has two trendlines that slope downwards, with one line acting as resistance (the upper trendline) and the other as support (the lower trendline).
Inside the wedge, the price creates lower highs and lower lows, but the fall slows down over time, which signals the price might soon reverse and start rising. This pattern is considered a bullish reversal, meaning it suggests the price could go up once the pattern is complete.
How to Identify
Follow these steps to identify the falling wedge perfectly:
- Look for a clear downtrend
- Draw two trendlines, one along the lower highs (resistance) and the other along the lower lows (support).
- Make sure the price is moving within the wedge and the gap between the two lines gets smaller over time.
- The pattern is confirmed when the price breaks above the upper trendline resistance.
Formation of Falling Wedge Chart Pattern
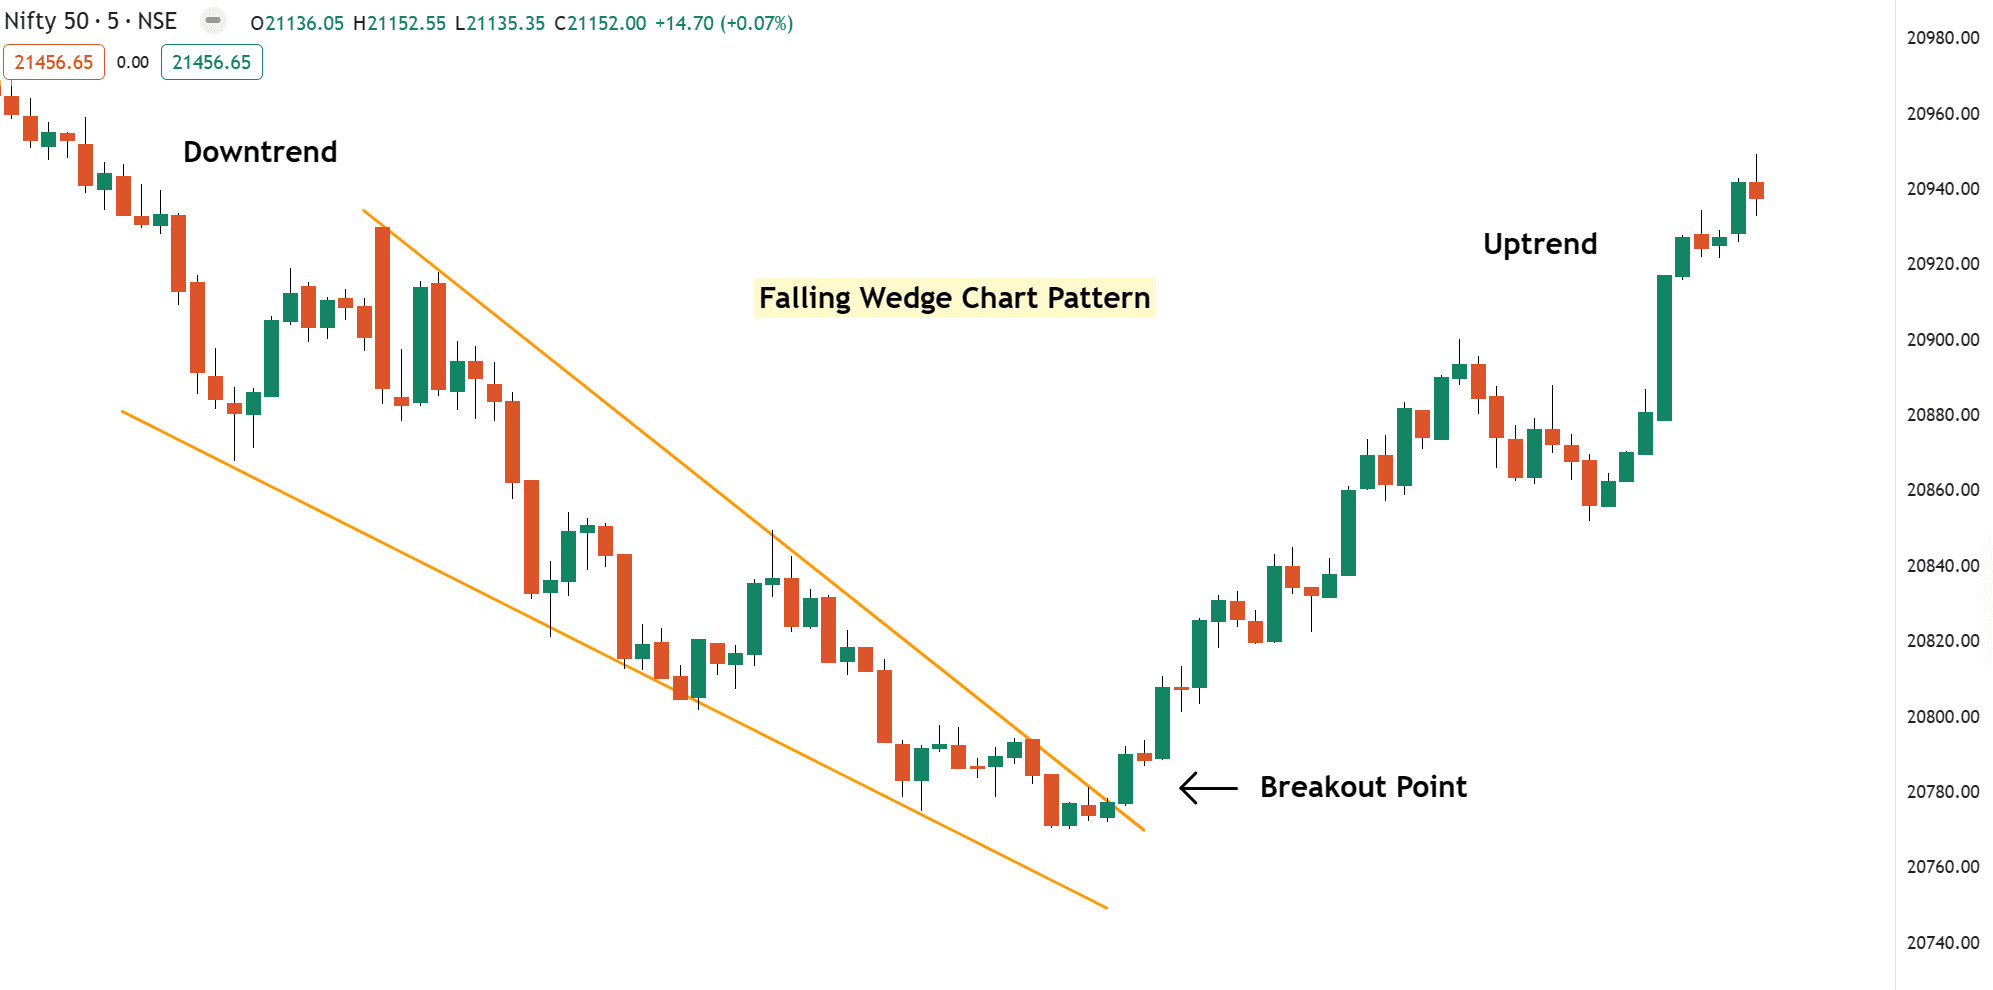
Example 1: Nifty 50 Falling Wedge Formation Analysis

Downtrend
This is a first phase where the market is in a downtrend, and the price keeps making lower highs and lower lows. This means sellers are in control, and the price is falling strongly.
Wedge Formation or Consolidation
As the pattern forms, the speed of the fall starts to slow down. The price is still making lower highs and lower lows, but the moves are smaller.
The upper trendline resistance is going down slowly, and the lower trendline support is also going down but at a steeper angle. Now, these two lines get closer and form a wedge shape, showing that sellers are losing strength and buyers may soon enter aggressively.
Breakout
The pattern is complete when the price breaks above the resistance line (the upper trendline). This breakout signals that the downtrend is over.
This pattern is the perfect example of price action, where lower lows and lower highs are getting narrow, showing the market going down step by step, but sellers lose their momentum. Now, that means sellers are weak, and a sudden bullish breakout shows the trend get reverse and price will go high.
How to Trade Falling Wedge Pattern
There are some rules when trading with Falling Wedge
Once you’ve spotted this pattern, prepare for the perfect trading entry!
Entery Point
Enter the trade when the price breaks above trendline resistance and wait for a candle close above the resistance to get confirmation.
Or you can wait for a Retest/Pullback to protect from falls breakout
Stop Loss
Place the stop loss below the bottom of the last low inside the wedge.
If the price moves in your direction, trail your stop loss using a technical indicator like moving average or ATR to protect your gains.
Profit Target
Measure the height of the wedge from the widest point (the initial price range), then add that same distance above the point where the breakout happens. This gives you a rough idea of where the price might go next.
Pros & Cons of Falling Wedge Chat Pattern
Pros
- This pattern helps to find trend reversal.
- Suitable for short-term trading
Cons
- False breakouts possible (Candle Wicks)
- A Falling Wedge is a bullish reversal pattern, but if the overall market sentiment remains strongly bearish, the pattern may fail.
Common Mistakes to Avoid
When trading with this pattern, avoid some common mistakes like trading inside the range and relying too much on textbook patterns.
- Don’t enter before the breakout confirmation.
- Misdrawing trendlines or forcing pattern
Most importantly, if the pattern looks confusing, it’s okay to skip the trade to protect your capital is more important.
Have you traded the Wedge pattern before? What is your favorite chart pattern aside from this one?
Let me know in the comments below!…..

