Summary: The Diamond Bottom Chart Pattern is a shape that looks like a diamond and usually appears at the end of a downtrend. It tells traders that the price might go up soon. When the price breaks out above the pattern, it can be a good time to buy. It’s rare but powerful.
In this blog post, we’ll learn about the diamond bottom chart pattern, how to identify it, trading strategies, examples, and essential tips to consider while trading with it. So, let’s discuss…
What is the Diamond Bottom Chart Pattern?

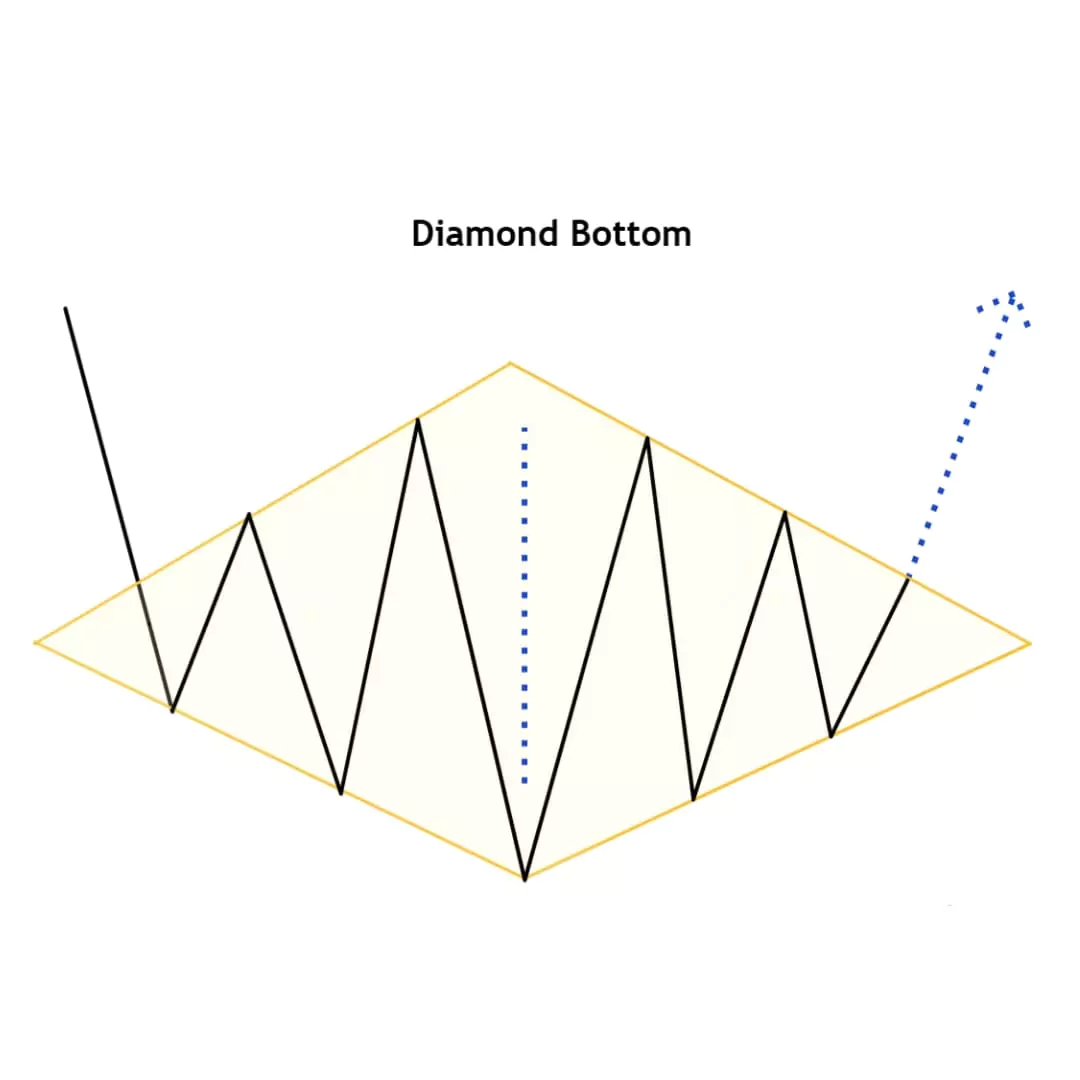
The Diamond Bottom Chart Pattern is a rare but powerful bullish reversal pattern that forms at the end of a downtrend. Shaped like a diamond, this pattern signals a potential trend reversal from bearish to bullish.
It gets its name from the diamond-like shape that forms as price volatility widens and then narrows.
It’s the opposite of a Diamond Top, which appears after an uptrend and indicates a bearish reversal.
How to Identify Diamond Bottom Chart Pattern
To identify the Diamond Bottom pattern on a chart:
- Look for the widening of price action with higher highs and lower lows (expanding triangle).
- Followed by narrowing price action forming lower highs and higher lows (contracting triangle).
- The overall shape resembles a diamond or rhombus.
- It usually forms on higher timeframes and is more reliable when accompanied by high volume during a breakout.
Formation of Diamond Bottom Pattern

The pattern forms after a downward movement in price.
Expansion Phase
The price starts moving up and down in bigger swings. It becomes unpredictable and more volatile, like the price is trying to figure out what to do next.
Contraction Phase
Now, the wild price swings have started to calm down. The price moves in a tighter range, like it’s getting ready for something big.
Breakout
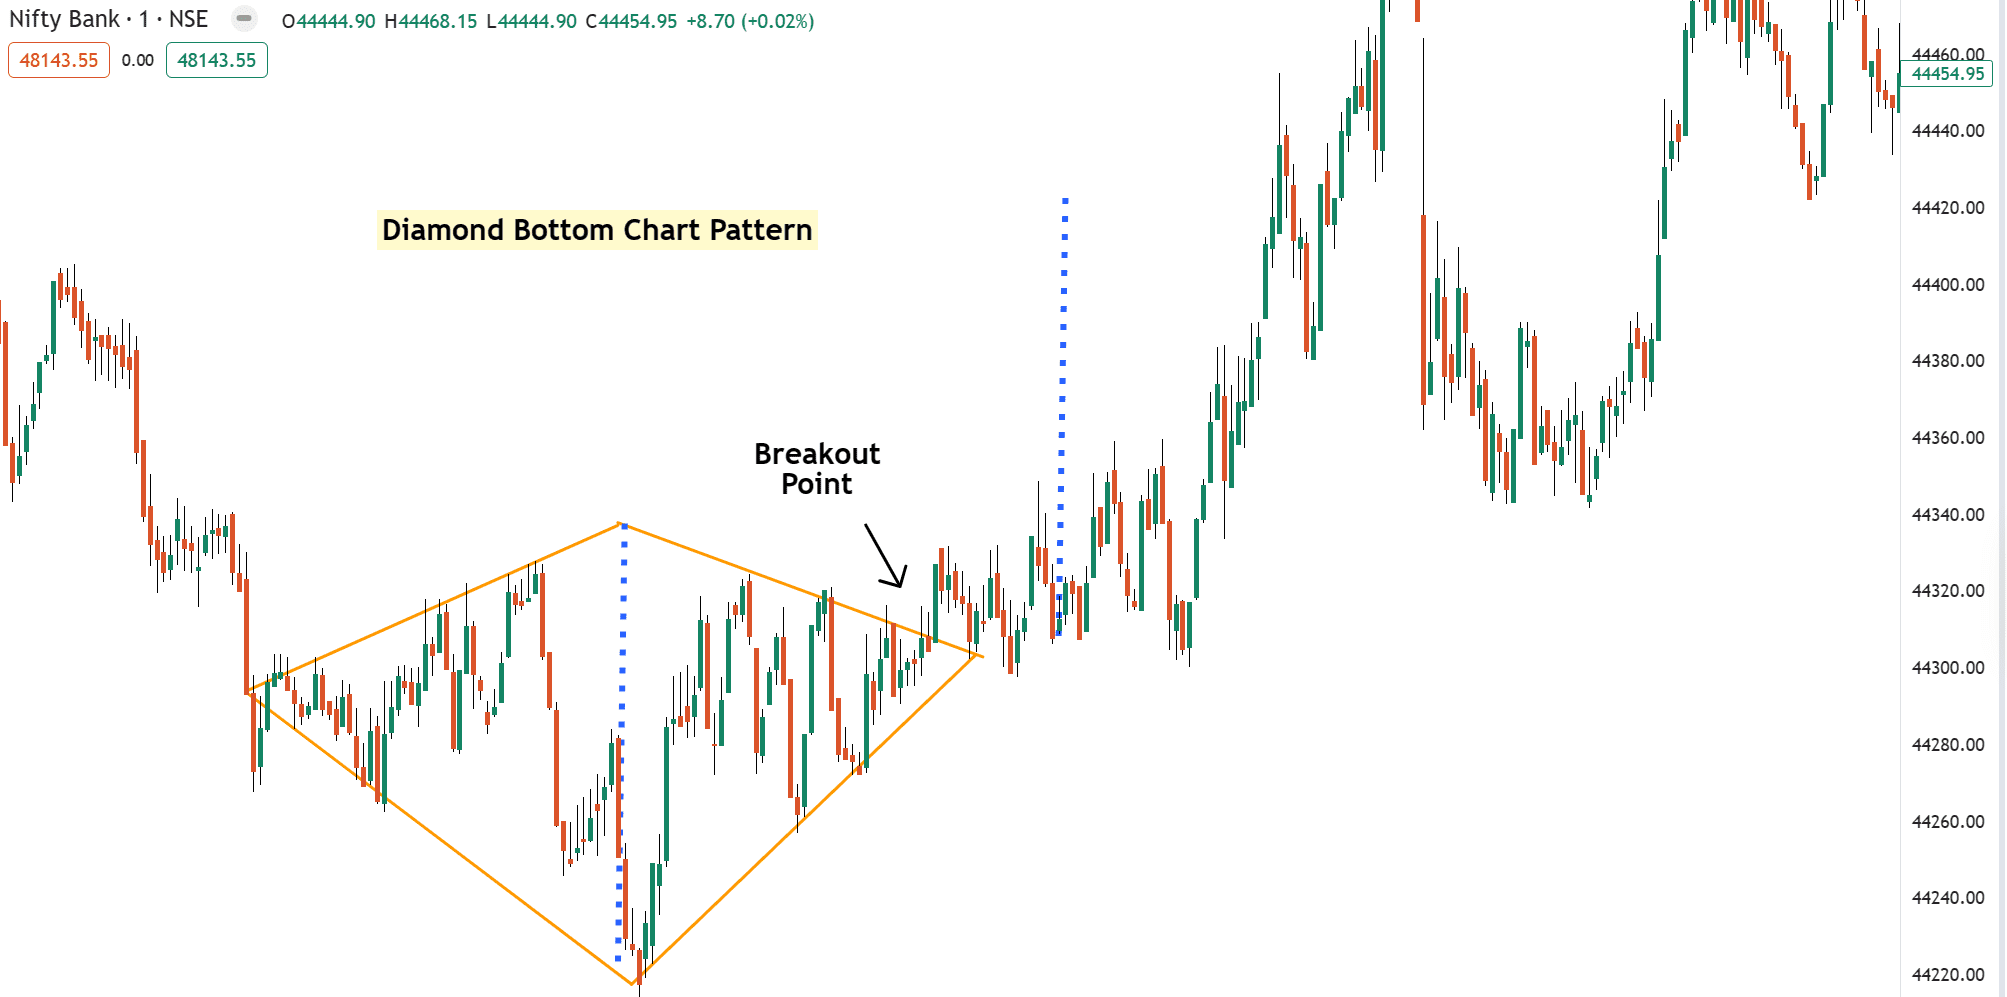
Finally, the price breaks above the top trendline of the pattern. This is a strong signal that the trend is reversed, and the price starts going up.
How to Trade the Diamond Bottom Pattern
Here’s the complete guide, how traders can trade this pattern…
Entery Point
Enter the trade when price breaks above the upper trendline of the contraction phase.
Stop Loss
Place the stop loss below the lowest point of the diamond pattern to protect against false breakouts.
If the price moves in your direction, trail your stop loss using this technical indicator to protect your gains.
Profit Target
Measure the height of the diamond from its widest point, then add that same distance above the point where the breakout happens. This gives you a rough idea of where the price might go next.
Pros & Cons of Diamond Bottom Pattern
Pros
- Find the reversal signal.
- Suitable for short-term trading
Cons
- Rare, not commonly found.
- False breakouts possible (Candle Wicks)
Common Mistakes to Avoid
When trading with this pattern, avoid some common mistakes like trading inside the range and relying too much on textbook patterns.
- Misidentifying pattern: not every diamond-shaped structure is a true Diamond Bottom.
- Trading without waiting for confirmation of a breakout.
Most importantly, if the pattern looks confusing, it’s okay to skip the trade to protect your capital is more important.
Have you traded the Diamond pattern before? What is your favorite chart pattern aside from the Diamond?
Let me know in the comments below!…..

