Summary: The Ascending Triangle Pattern is a bullish continuation chart pattern formed by a horizontal resistance and rising trendline support. It forms when the price keeps hitting the same high but also makes higher lows. This means buyers are pushing the price up and indicates increasing buying pressure leads to a breakout above resistance. Traders use this pattern to identify bullish trends.
In this blog post, we’ll learn about the bullish Ascending Triangle chart pattern, how to identify it, trading strategies, examples, and essential tips to consider while trading with it. So, let’s discuss…
What is the Ascending Triangle Chart Pattern?

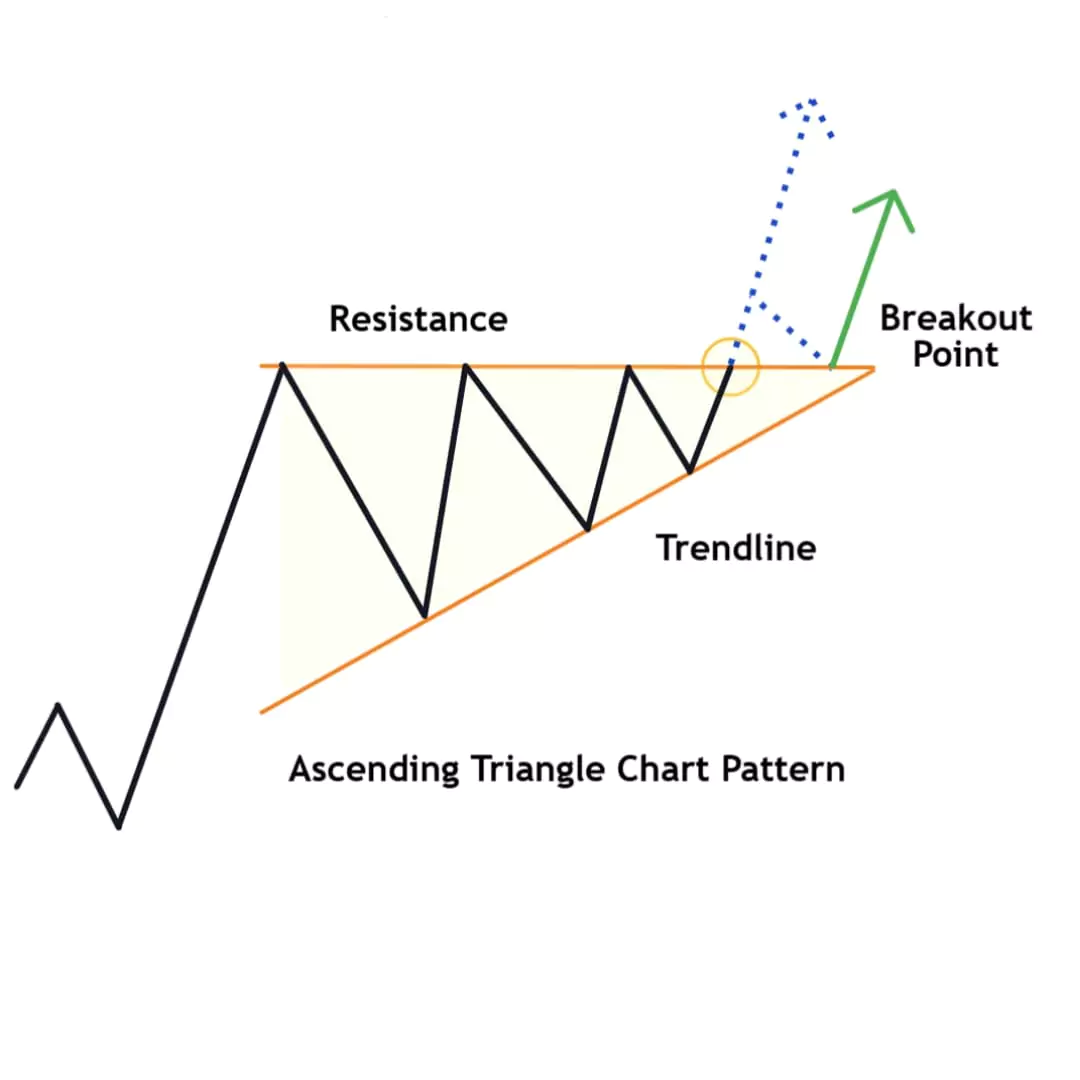
The Ascending Triangle Pattern is a powerful bullish chart formation that forms during an uptrend and includes a great price action concept. It features:
- A horizontal resistance line at the top
- An upward trendline support at the bottom
The price moves within this triangle, making higher lows while facing resistance at the same level, which is a horizontal line. A breakout above the resistance line confirms the continuation of the bullish trend.
How to Identify
Follow these steps to identify the ascending triangle perfectly:
- Horizontal Resistance: Price hits a resistance level multiple times, which forms a horizontal resistance.
- Tendline Support: Price makes higher lows, forming an upward trendline.
- Breakout: The pattern is confirmed when the price breaks above the resistance.
Formation of an Ascending Triangle Pattern
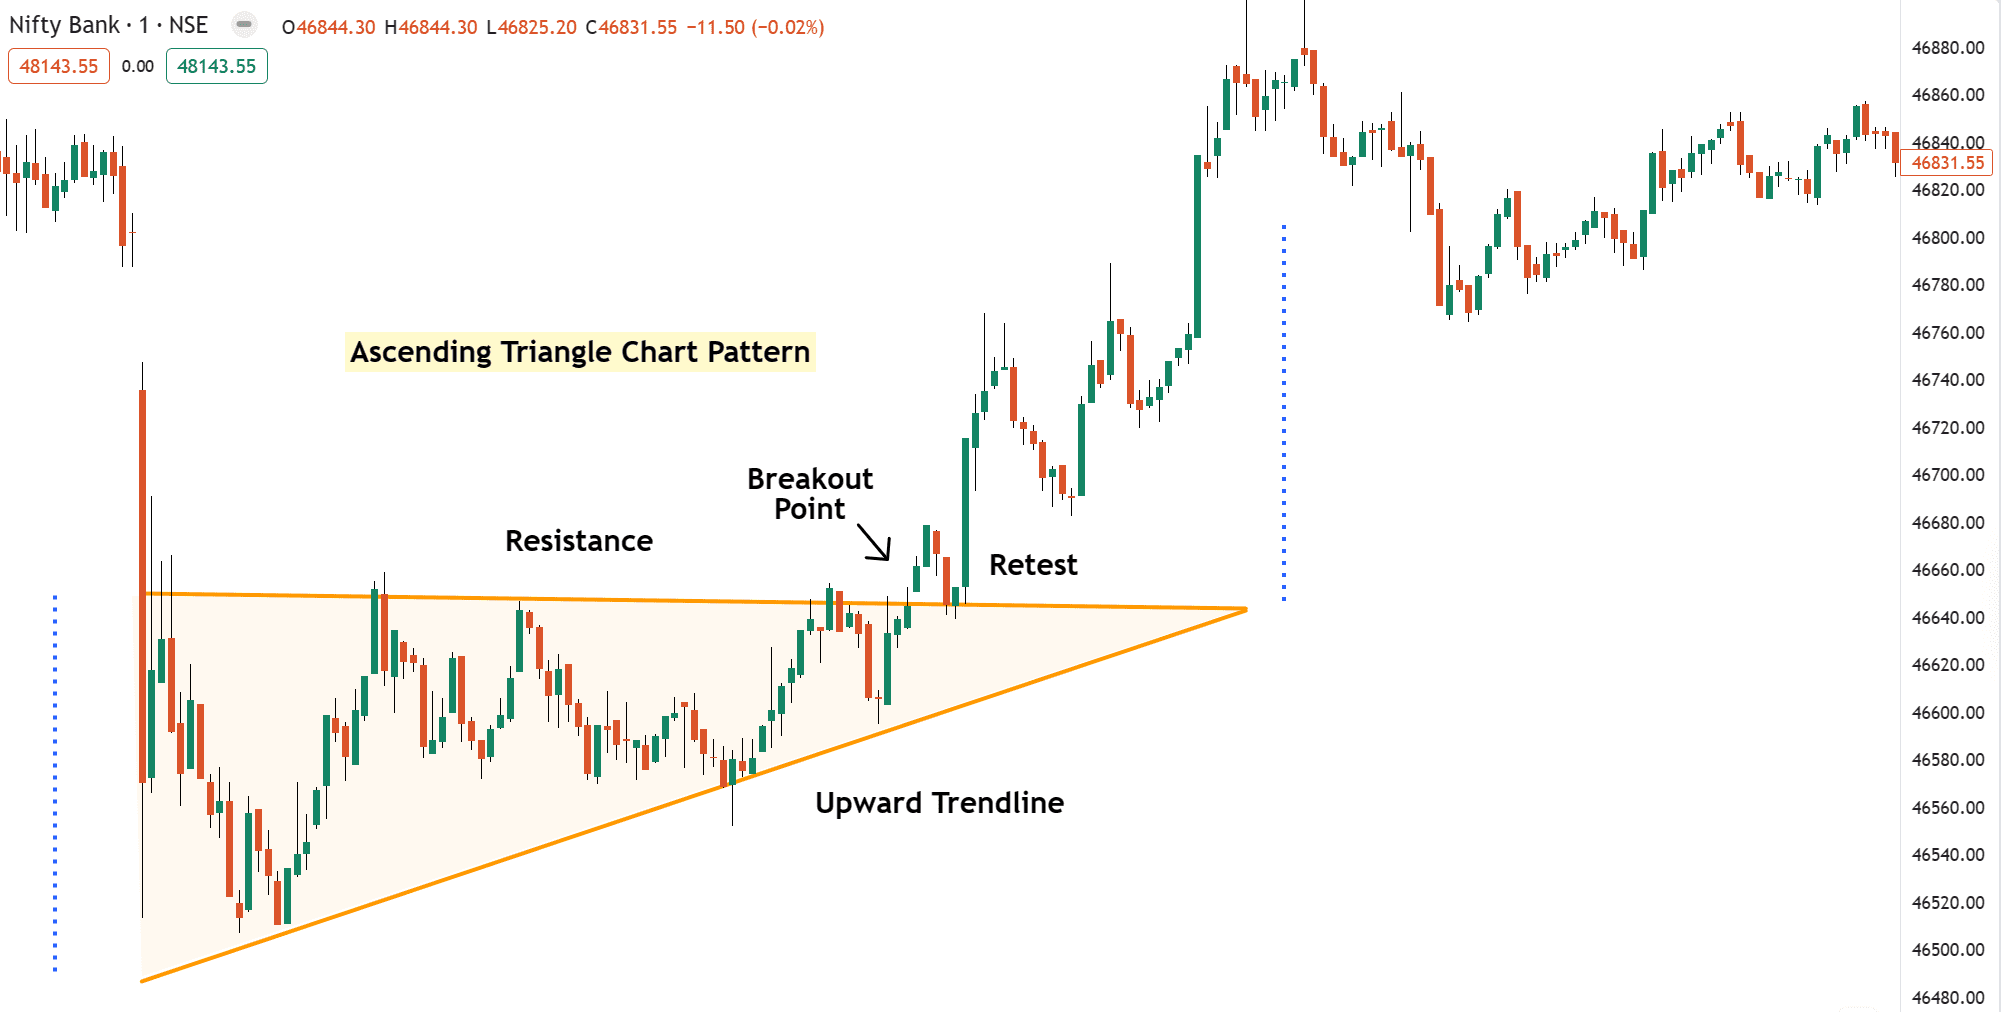
Example 1: Nifty Bank Ascending Triangle Formation Analysis

Horizontal Resistance
Drawn horizontally across swing highs where price faces repeated resistance, which indicates a strong seller presence at that level.
Trendline Support
Drawn upward trendline, connecting a series of higher lows. Indicates that buyers are stepping in at increasingly higher levels, showing that buyers are also entering and the prices are moving in a narrow range.
Breakout
The breakout mostly happens in the same direction the price was already moving, usually going up. This pattern is the perfect example of price action, higher lows show the market going up step by step and sellers are trying multiple times now that they are weak and the market is ready for a bullish rally.
How to Trade the Ascending Triangle Pattern
There are some rules when trading with the Ascending Triangle Pattern.
Once you’ve spotted this masterpiece, prepare for the perfect trading entry!
Entery Point
Enter the trade when the price breaks above horizontal resistance and wait for a candle close above the resistance to get confirmation.
Or you can wait for a Retest/Pullback to protect from falls breakout
Stop Loss
Place the stop loss below the bottom of the recent higher low or swing low.
If the price moves in your direction, trail your stop loss using this technical indicator to protect your gains.
Profit Target
Measure the height of the triangle (from resistance to lowest point of support), then add that same distance above the point where the breakout happens. This gives you a rough idea of where the price might go next.
Pros & Cons of Ascending Triangle Pattern
Pros
- A pattern helps to follow the trend.
- Provides well-defined entry, stop-loss, and target levels.
- Suitable for short-term trading
Cons
- May take time to fully form.
- False breakouts possible (Candle Wicks)
Common Mistakes to Avoid
When trading with this pattern, avoid some common mistakes like trading inside the range and relying too much on textbook patterns.
- Don’t enter before the breakout confirmation.
- Misdrawing trendlines (forcing pattern)
Most importantly, if the pattern looks confusing, it’s okay to skip the trade to protect your capital is more important.
Have you traded the Ascending triangle pattern before? What is your favorite chart pattern aside from this one?
Let me know in the comments below!…..
