Summary: The Triple Top Chart Pattern is a bearish reversal pattern that forms after an uptrend. It consists of three consecutive highs or peaks at nearly the same level, creating a strong resistance zone. The breakout below the neckline support signals an increase in selling pressure and shifts sentiments toward a bearish trend. Traders enter a short position after the breakdown of the neckline support.
In this blog post, we’ll learn about the triple top chart pattern, how to identify it, trading strategies, examples, and important tips to consider while trading with it. So, let’s discuss…
What is the Triple Top Chart Pattern?

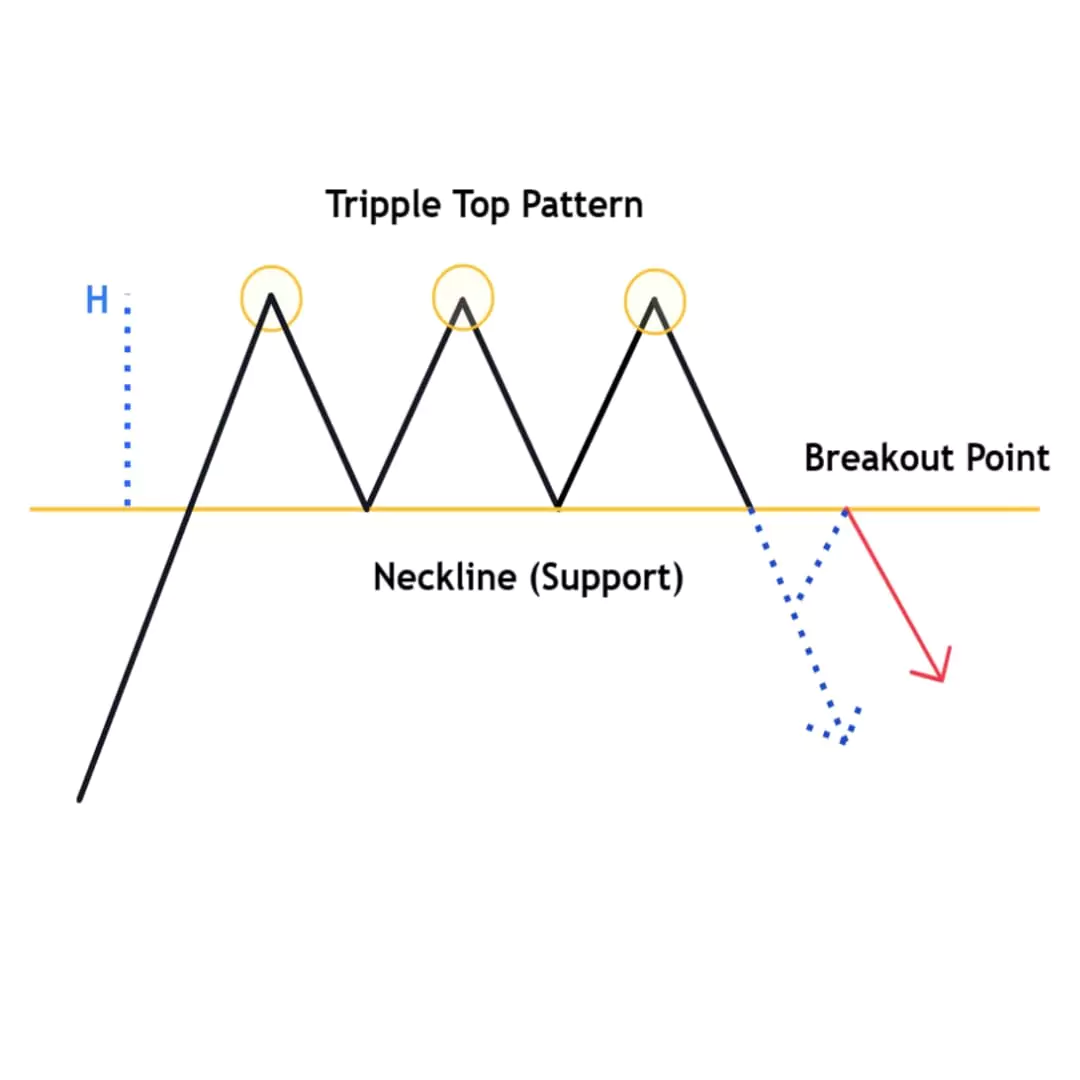
The Triple Top Pattern is a technical analysis chart pattern used to find a bearish reversal. It is characterized by three nearly equal highs followed by a strong breakout below the support/neckline formed by lows between the peaks.
The pattern is complete once the price breaks below the neckline (support level), indicating a change in market sentiment from bullish to bearish.
This pattern usually forms over a longer period of time that means pattern likes to take its own sweet time to develop and shows a struggle between buyers and sellers before sellers finally gain control. Remember, this pattern tests your patience and discipline.
If you missed the double top pattern, there is no need to regret it, traders! Because the triple top pattern is here to save you, giving you a second chance to join the new trade.
How to Identify Triple Top Chart Pattern
To find the Triple Top Chart Pattern correctly, follow these steps:
- First, find three consecutive highs: the price reaches the resistance level three times without breaking above.
- Draw Neckline/Support Line: Draw a horizontal support line connecting the two lows that form between the three peaks.
- Breakout: This pattern is only confirmed after the price breaks below the neckline support.
Formation of Triple Top Pattern
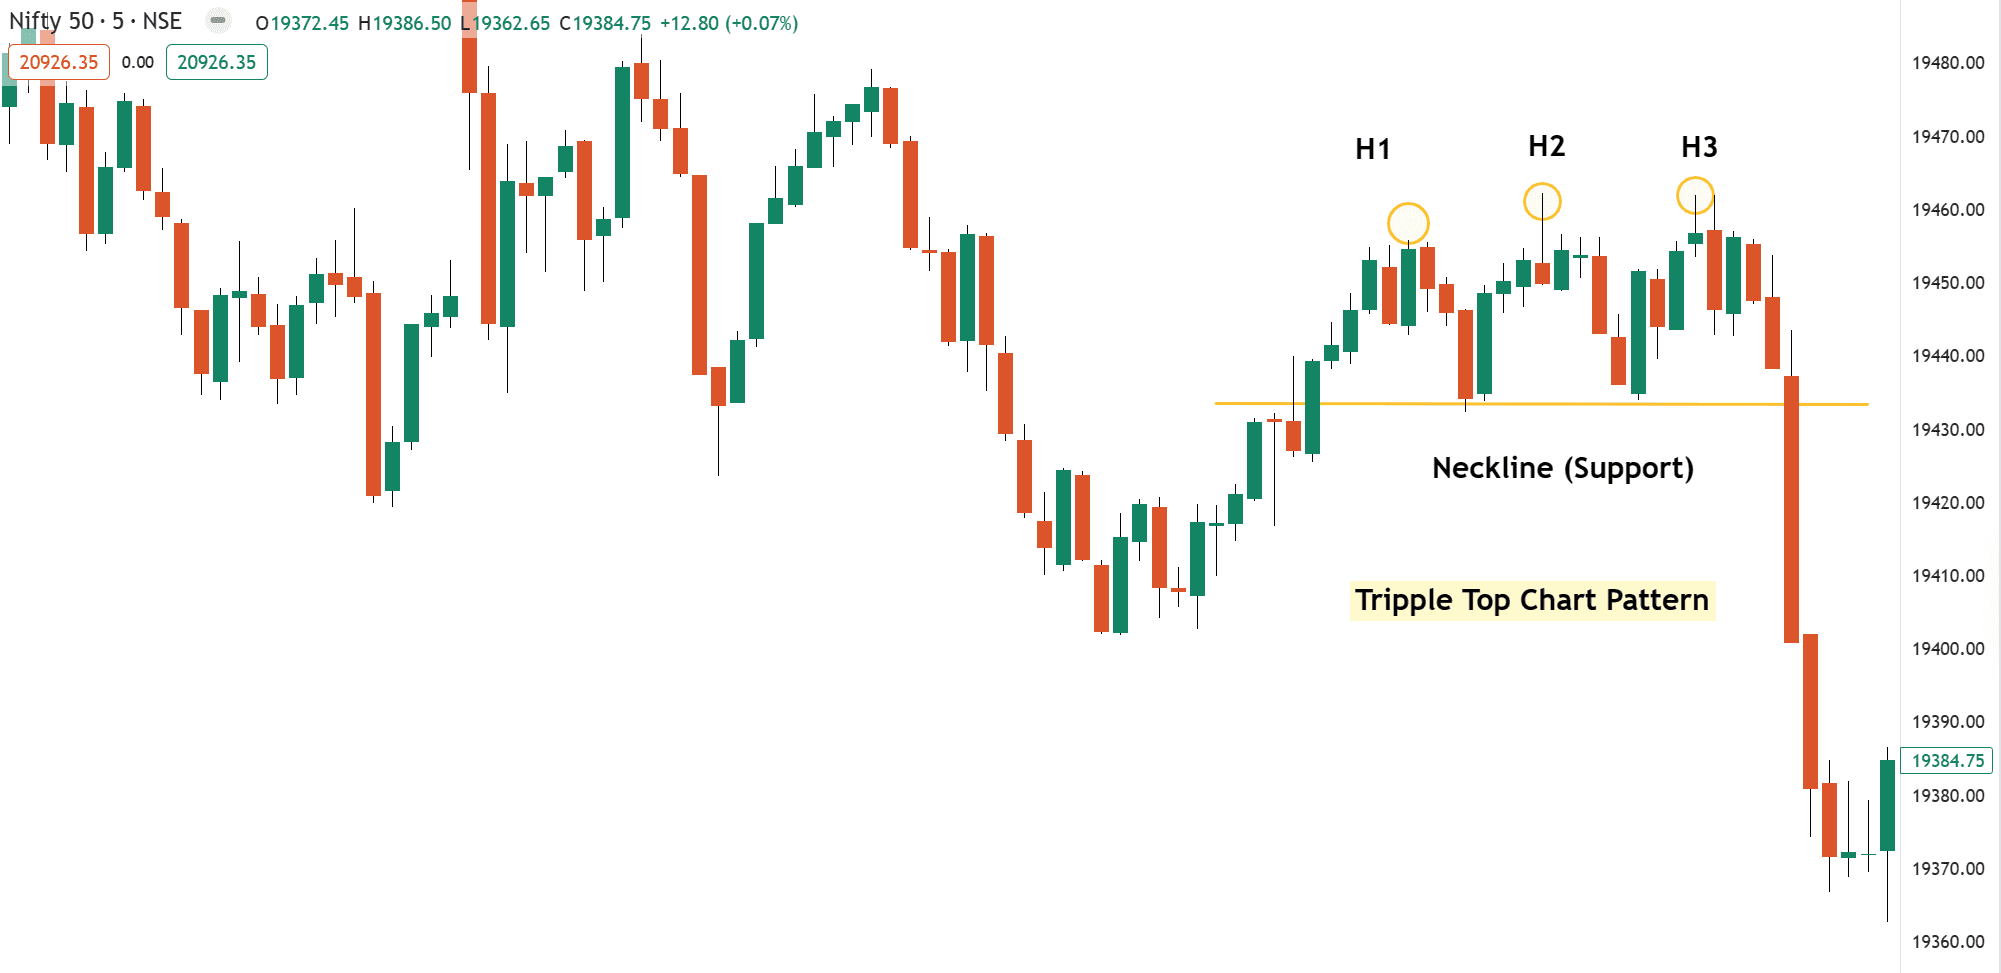
Example 1: Nifty 50 Triple Top Formation Analysis

A triple top is a bearish reversal chart pattern that forms after an uptrend.
This pattern is formed with three highs bove the neckline support level
Three High (Acts as a Resistance)
First, identify the Triple Top formation, where the price reaches approximately the same level three times.
Neckline (Acts as a Support)
Formed between the three highs and acts as a support line. Make sure to accurately identify the neckline (Refer to the example above) with all three highs clearly forming above this support line.
Breakout
Note, the formation of this pattern is completed when the price breaks below the neckline after forming a third high, and the pattern is confirmed so traders can enter in bearish positions.
How to Trade Triple Top Pattern
There are certain rules when trading with Triple top chart patterns..
Once you’ve spotted this Triple Top masterpiece, prepare for the perfect trading entry!
Entery Point
When the price confidently breaks below the neckline, it is a sign that the triple top is about to reveal its full potential.
Traders enter a short position when the price breaks below the neckline or support level. This breakout offers a good opportunity to ride the wave of success!
Stop Loss
The stop loss should be placed above the third high of the pattern to manage risk.
If the price moves in your direction, trail your stop loss using this technical indicator (eg, 20 Moving Average) to protect your gains.
Profit Target
Measure the distance between the high and the neckline and Add this distance to the breakout point likely 1:1 to determine the profit target.
Pros & Cons of Triple Top Chart Pattern
Pros
- Find Strong Bearish trend
- Provides perfect entry and exit points
- Effective in various timeframes
Cons
- Requires high patience for pattern completion because it takes too much time
- False breakouts
Common Mistakes to Avoid
When trading on triple top, avoid common mistakes like trading inside the range and relying too much on textbook patterns.
- Avoid early entry
- If data is confusing, don’t place a trade; wait for the next opportunity and protect capital first…
Have you traded double or Triple top patterns before? What is your favorite chart pattern aside from the Triple Top?
Let me know in the comments below!…..

