Summary: The Inverse Head and Shoulders Pattern is a bullish chart pattern formed after a downtrend that signals the buyers are in control. The pattern is shaped like a person’s head and two shoulders reversed, It features mainly three troughs: a deeper middle trough (head) between two shallower troughs (shoulders). The pattern completes when the price breaks above the neckline, signaling a potential upward movement.
In this blog post, we’ll learn about the inverse head and shoulders chart pattern, how to identify it, trading strategies, examples, and important tips to consider while trading with it. So, let’s discuss…
What is the Inverse Head and Shoulders Chart Pattern?

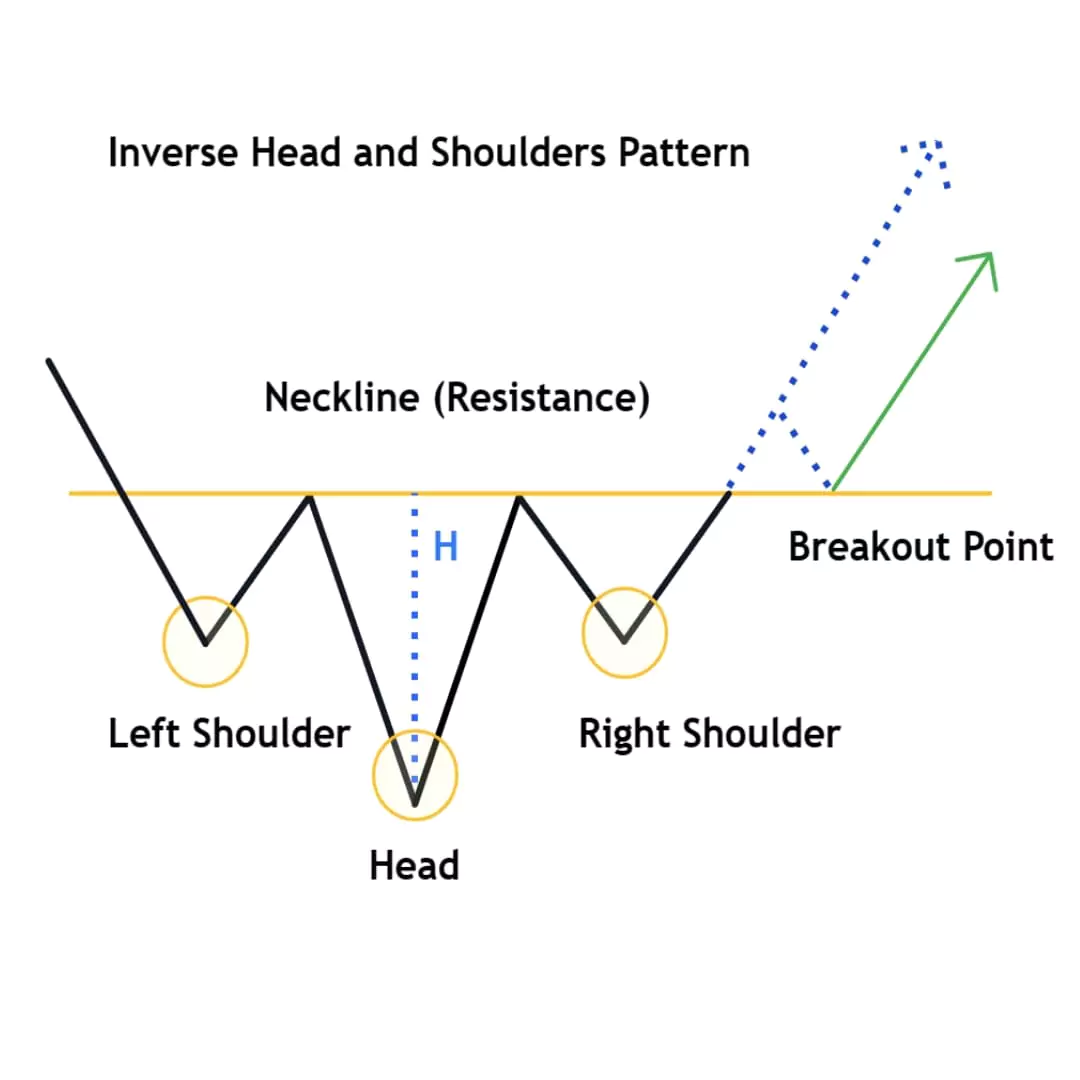
The Inverse head and shoulders chart pattern is also known as the Reverse head and shoulders pattern. This pattern is used in technical analysis to find the bullish movement. It is the opposite of the standard head and shoulders pattern.
This pattern includes three dips: the deepest or lowest one in the middle (known as the head) and two smaller ones on each side (known as shoulders). Refer above image.
The pattern is complete when the price breaks above the resistance line or neckline. Indicates change in market sentiment from bearish to bullish.
How to Identify the Inverse Head and Shoulders Chart Pattern
It’s very simple, Just look for the inverted head and shoulders shape correctly (similar to the shape of a person’s head and two shoulders in an inverted position) and follow these steps:
- Find the pattern after a significant downtrend.
- First, the price falls and rises with a new high, but the second time price falls below the previous trough and then rises again to its same high, In last Finally, the price falls, but not as far as the second trough and go back to its first high, known as neckline.
- The neckline is a horizontal line (in some cases trendline is also correct) that connects the highs between the two shoulders. It acts as a resistance level before the pattern completes.
- This pattern is only confirmed after the price breaks above the neckline.
Formation of Inverse Head and Shoulders Chart
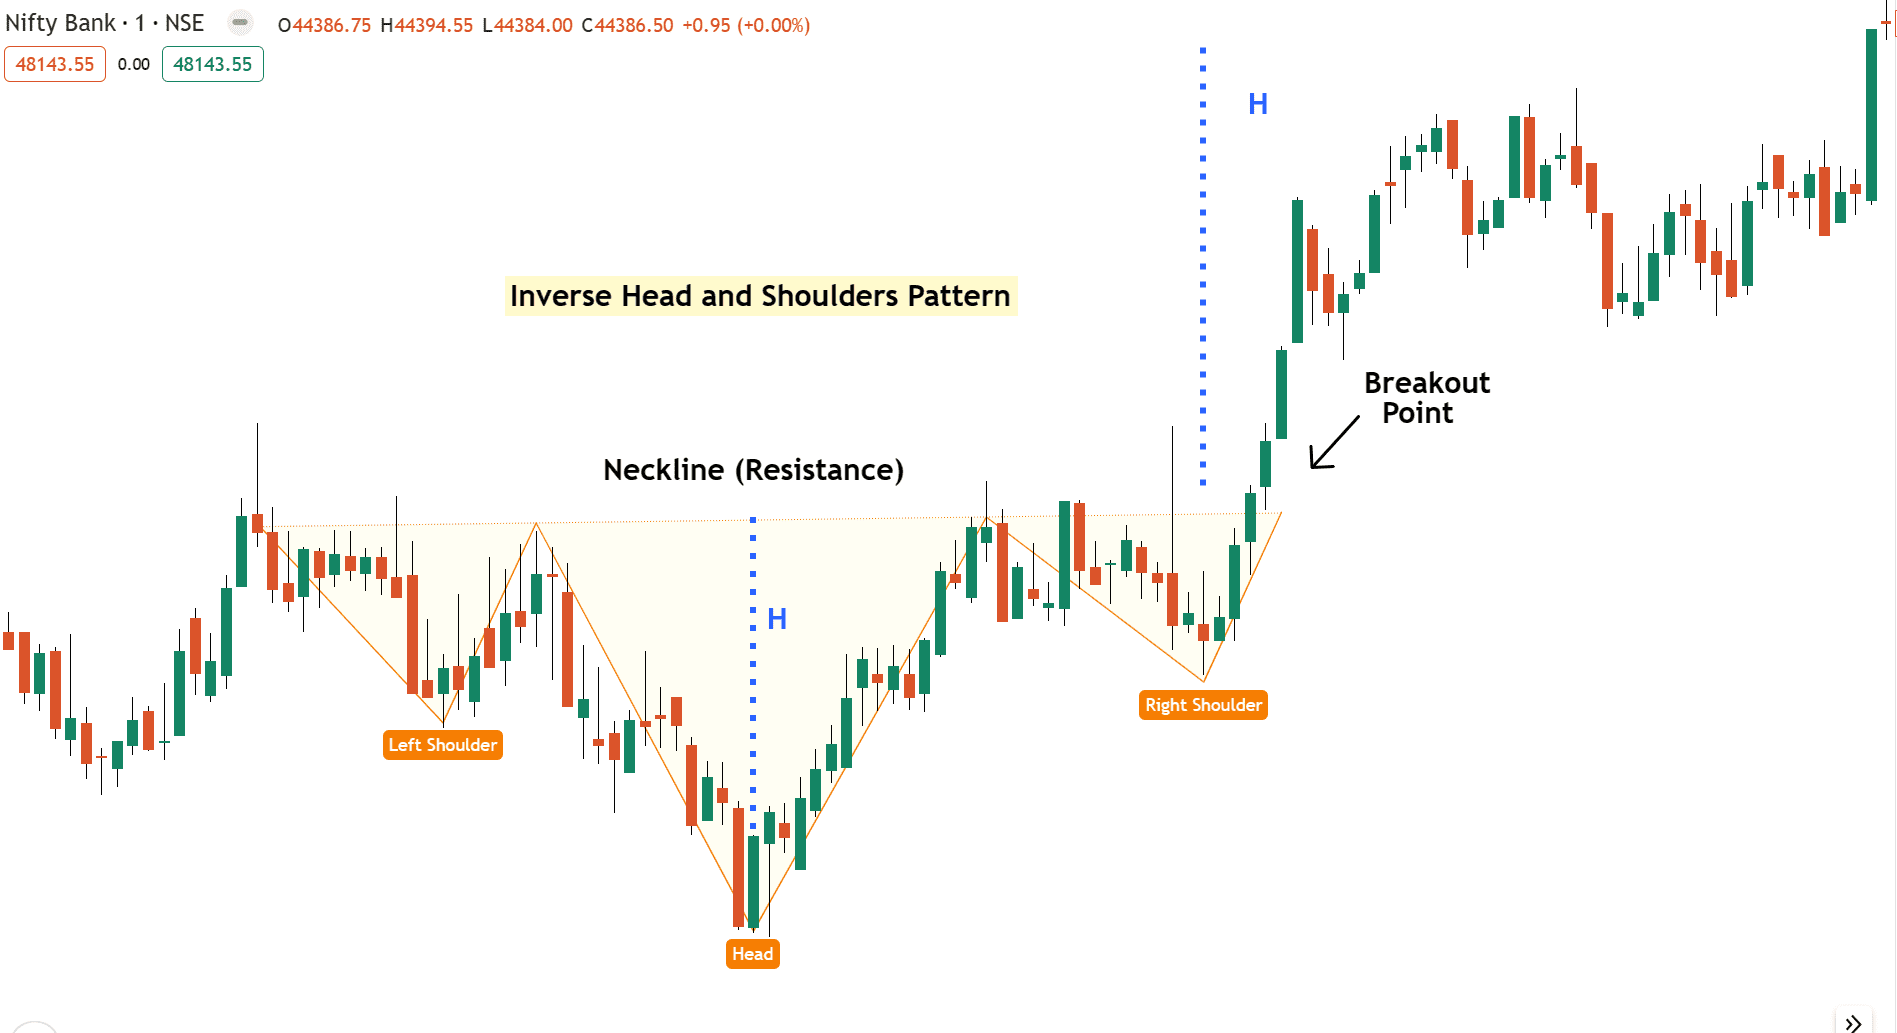
Example 1: Nifty Bank Formation Analysis

Left Shoulder
The first low forms after a decline and represents a temporary low known as left shoulder (Refer above eg)
This is a pullback against the downtrend because of profit booking or exits by traders.
Head
This is a second deeper low than the shoulders and make the lowest point of the pattern.
This middle lower low shows sellers are still in control, they push the price lower but buyers are also stepping in, which explains the “stronger” pullback to re-test the previous high.
Right Shoulder
Now this is a higher low similar in height to the left shoulder that indicates weakness in downtrend momentum.
This low represents sellers are getting weak as they couldn’t push the price lower. but buyers are stronger as they continue to push the price in upward.
Neckline
A resistance line (horizontal/trendline) drawn across the peaks between the head and shoulders.
And if the price breaks above neckline or resistance line, the Inverse Head and Shoulders pattern is “confirmed”, and the market ready to continue bullish rally.
How to Trade Inverse Head and Shoulders Pattern
There are certain rules when trading with inverse head and shoulders chart patterns.
Once you’ve spotted this Inverse head and shoulders masterpiece, prepare for the perfect trading entry!
Entery
When the price confidently breaks above the neckline, it is a sign that the pattern is about to reveal its full potential.
Traders enter a long position when the price breaks above the neckline or resistance level. This breakout offers a good opportunity to ride the wave of success!
Note: If you miss the breakout, don’t “chase” the markets now wait for a proper pull back.
Our Experience – Use this three powerful entry techniques: The breakout with buildup, The Re-test, The First Pullback.
Stop Loss
The stop loss should be placed below the right shoulder of the pattern to get better risk reward ratio.
Note: If the price moves in your direction, trail your stop loss using this technical indicator (eg, 20 Moving Average) to protect your gains.
Exit
Measure the distance between the head to the neck and Add this distance to the breakout point likely 1:1 to determine the profit target.
If your SL below the right shoulder you consider your 1:2 risk reward ratio
Pros & Cons of Inverse Head and Shoulders Pattern
Pros
- Find strong bullish trend
- Provides better risk reward with clear entry and exits.
- Works well with using multiple timeframes (Pro tip use bigger timeframe for more accuracy)
Cons
- Requires high patience
- Requires more confirmation for accuracy (learn Price Action)
Common Mistakes to Avoid
The duration of the Inverse head and shoulders pattern plays a key role, the longer it takes to form, the stronger and more significant to find the reversal signal. Shorter patterns are weaker and more likely to get false breakouts, especially against the trend.
Here’s what I’m curious about…..
Have you traded the Inverse Head and Shoulders patterns before? What is your favorite chart pattern aside from the this?
Let me know in the comments below and share your thoughts!…..

