Summary: The Double Bottom Chart Pattern is a bullish reversal pattern that looks like a ‘W’ shape, formed by two nearly equal lows separated by a peak. It indicates a potential trend reversal from bearish to bullish. Traders look for a breakout above the neckline/resistance level and wait for a pullback to enter a long position.
In this blog post, we’ll learn about the double bottom (W) chart pattern, how to identify it, trading strategies, examples, and important tips to consider while trading with it. So, let’s discuss…
What is the Double Bottom Chart Pattern?

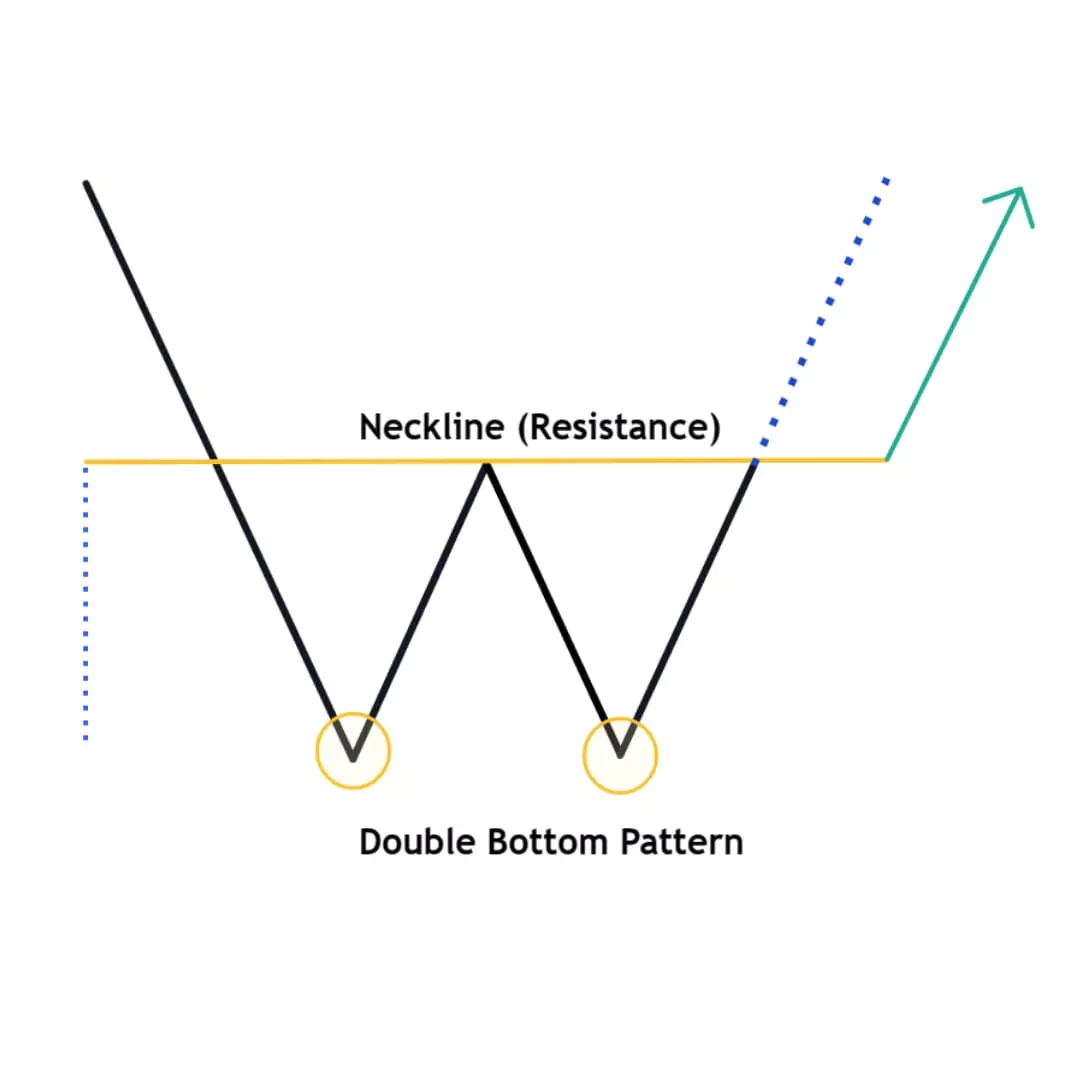
The Double Bottom Chart Pattern is also known as ‘W’ pattern. This pattern is used in technical analysis to analyse the bullish reversal signal using support and resistance levels. It forms in a downtrend and consists of two equal lows. It indicates a price reversal and shows the market is in bullish sentiment.
It is a bullish reversal chart pattern defined by two nearly equal lows in a downtrend followed by a breakout above the resistance level.
The pattern is complete once the price breaks above the neckline (resistance level), indicating a change in market sentiment from bearish to bullish.
How to Identify Double Bottom Chart Pattern
To find the Double Bottom Chart Pattern, follow these steps:
- Identify the Downtrend: Ensure the pattern forms in the downtrend
- Two Lows: Look for two lows at approximately the same price level, indicating a strong support zone
- Neckline: Resistance level, when the first low was formed and created a new peak level so we get a neckline.
- Breakout: The pattern is confirmed when the price breaks above the neckline (resistance)
Formation of Double Bottom ‘W’ Pattern
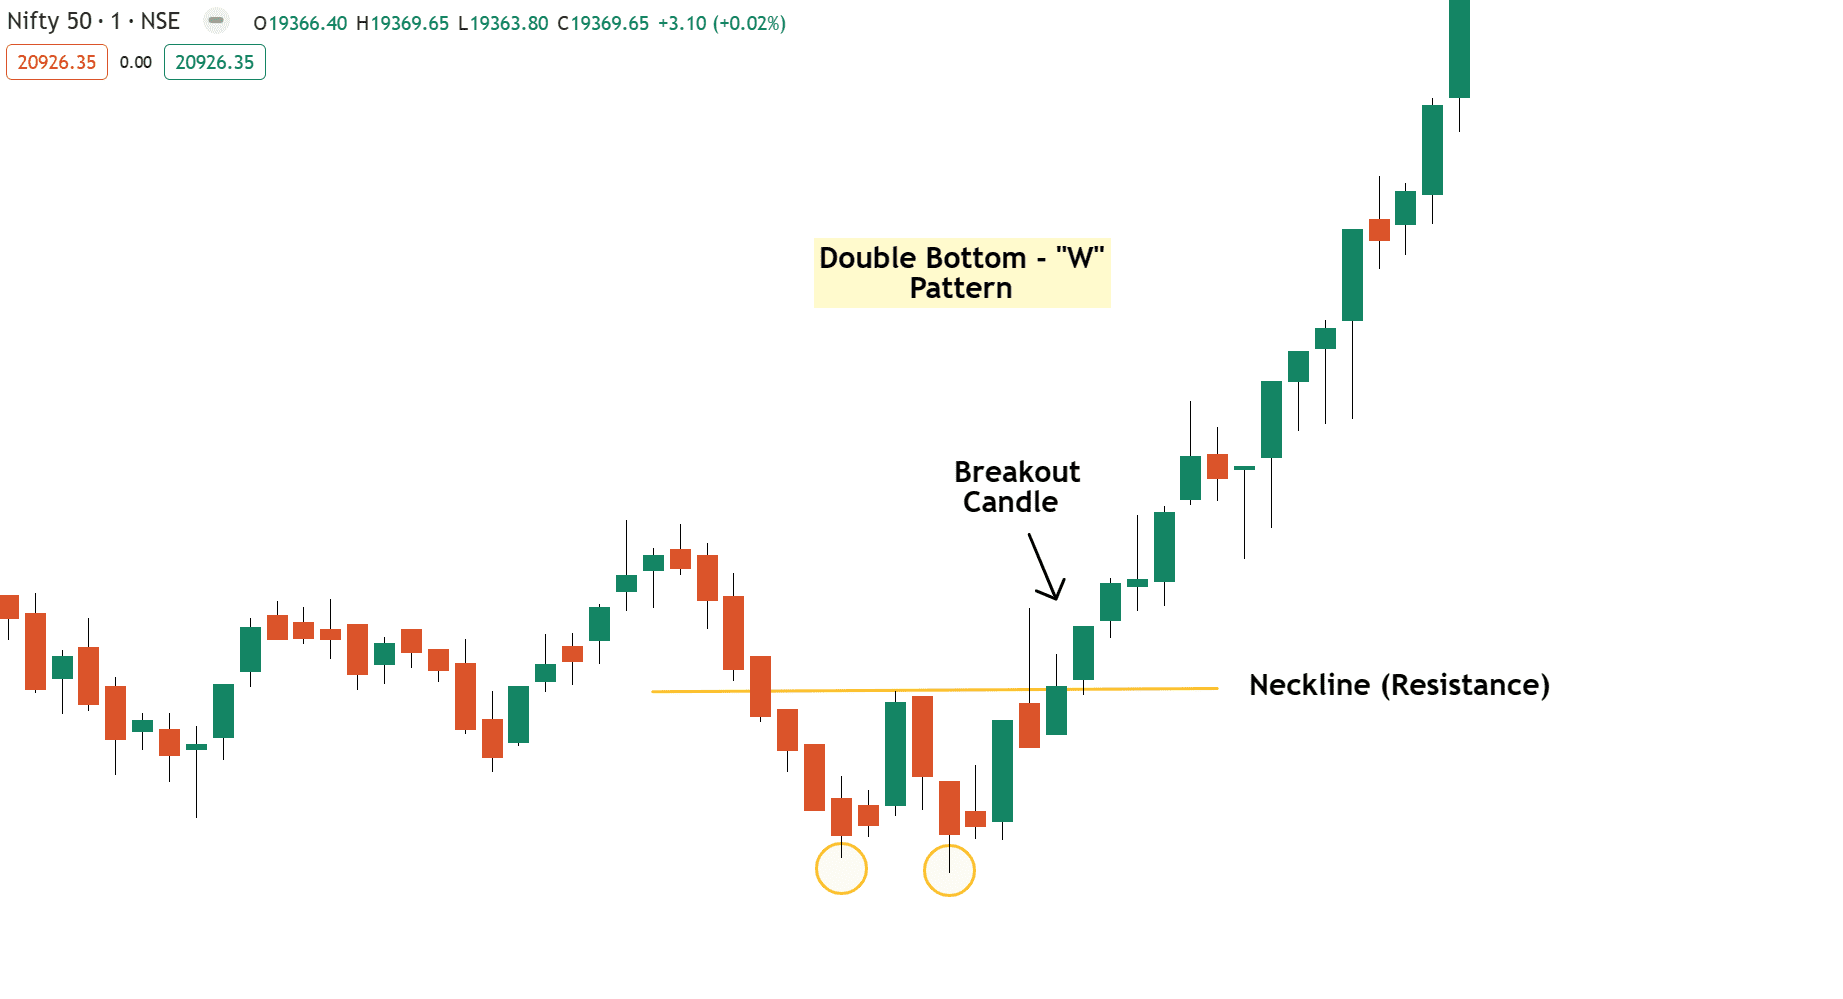
Example 1: Nifty 50 Double Bottom Formation Analysis

A double bottom is a bullish reversal chart pattern that is formed after an downtrend.
This pattern is formed with two lows below the resistance level, which is also known as a neckline
First Low
First, mark the initial point of support where the price stops declining and starts to reverse.
Second Low
Occurs after a moderate rally from the first low, creating a similar or slightly near previous low, confirming support level. Calculate the size of bot lows are slightly similar.
Neckline (Resistance)
Formed between the two lows and acts as a resistance line. Check the neckline correctly here and find both lows below the neckline or resistance line.
Breatkout Point
Note, the formation of this pattern is completed when the price breaks the resistance after forming a second low and the pattern is confirmed so traders can enter in bullish positions.
How to Trade Double Bottom Pattern
There are certain rules when trading with Double bottom ‘W’ chart patterns..
Traders should spot two equal bottoms and note the size of the bottoms.
Traders should only enter in a bullish direction when the price breaks out from the resistance level or the neckline level.
Entery Point
Traders enter a long position when the price breaks above the resistance level.
Stop Loss Strategy
The stop loss should be placed at the second bottom of the pattern to manage risk.
Profit Target
The price target should be 1:1 equal to the distance between the neckline and the bottoms.
Pros & Cons of Double Bottom Chart Pattern
Pros
- Provides perfect entry and exit points
- Effective in various timeframes (Note: The higher the timeframe, the better the pattern works)
Cons
- Requires patience for pattern completion
- False breakouts (for safety, always enter on pull back or retest)
- Not effective in sideways markets.
Common Mistakes to Avoid
Mostly, new traders place trades without confirming the breakout also not waiting for pullback as well as ignoring price action analysis like volume during breakout. Always remember that chart pattern shows the basic idea, but price action masters your mindset and experience to build your knowledge…
- Avoid early entry & early exits
- If data is confusing, don’t place a trade; wait for the next opportunity and protect capital first…
✨ Ready to enhance your trading skills? Join our FREE Trading community……


Very good work please hindi me bhi banao sir